158
Linearity tests
Linearity [L5]
354 mg/dL
350 360
08/11/03 10:24 AM
OP: Chris
Lot: 142387
4
1
2
7
3
6
5
8
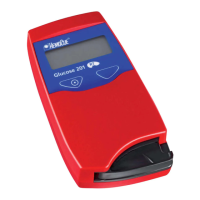
For a description, see 6.2.2 Linearity Test.
FIGURE 7-15
a) To browse through the available records,
use the scroll bar arrows(4).
b) To view statistics for the linearity test,
press the Statistics button(7). FIGURE
7-16 will be displayed.
c) Press the Confirm button(8).
FIGURE 7-10 will be displayed.
1 Date and time of test
2 Operator ID
3 Lot No. of Linearity material
4 Scroll bar arrows
5 Indicator for rejected test result
6 Result
7 Statistics button
8 Confirm button
Linearity
Result
N = 15
mg/dL
1 = 75 (70 - 80)
2 = 143 (140 - 150)
3 =
209 (210 - 220)
4 = 278 (280 - 290)
5 = 354 (354 - 360)
Out of Range
9
11
12
10
13
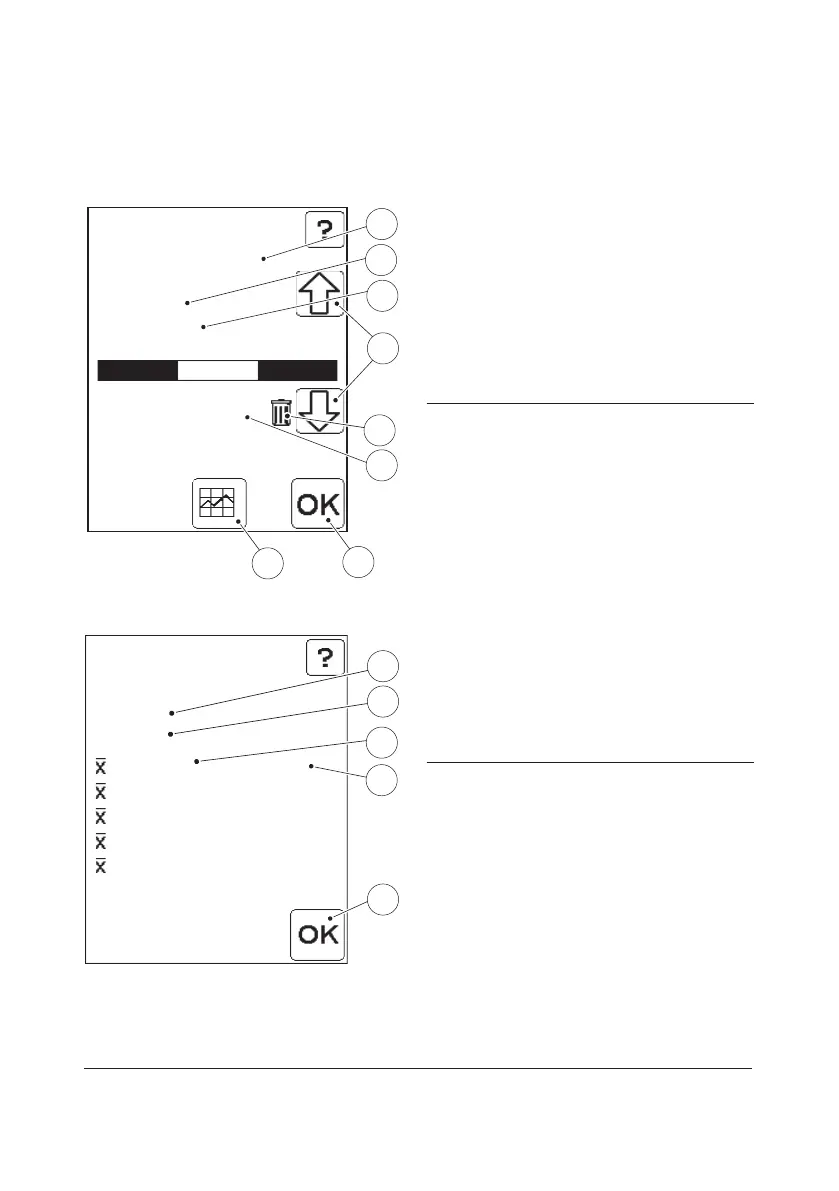
FIGURE 7-16
The image shows statistical data. For more
information on the image, see FIGURE 6-25.
d) Press the Confirm button. FIGURE 7-10
will be displayed.
9 Total No. of Cuvettes used in the linearity test
10 Unit for analyte concentration
11 Mean result for the level
12 Concentration min. and max. value for the level
13 Confirm button
 Loading...