+$%&
4
HP
PrecisionScan Pro
User’s Guide
81
Adjusting images of
pictures
Book Contents
Index
➮
➮
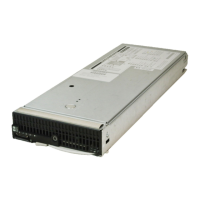
Pixel distribution histogram
The histogram in the
Exposure Adjustment
tool is a
graph of the distribution of pixels in the selection area.
The vertical lines in the histogram show the current
settings for
Shadows
and
Highlights
.
➊
The magenta line in the histogram represents the
current setting for
Shadows
, the darkest areas in the
image.
➋
The red line in the histogram represents the current
setting for
Highlights
, the lightest areas in the image.
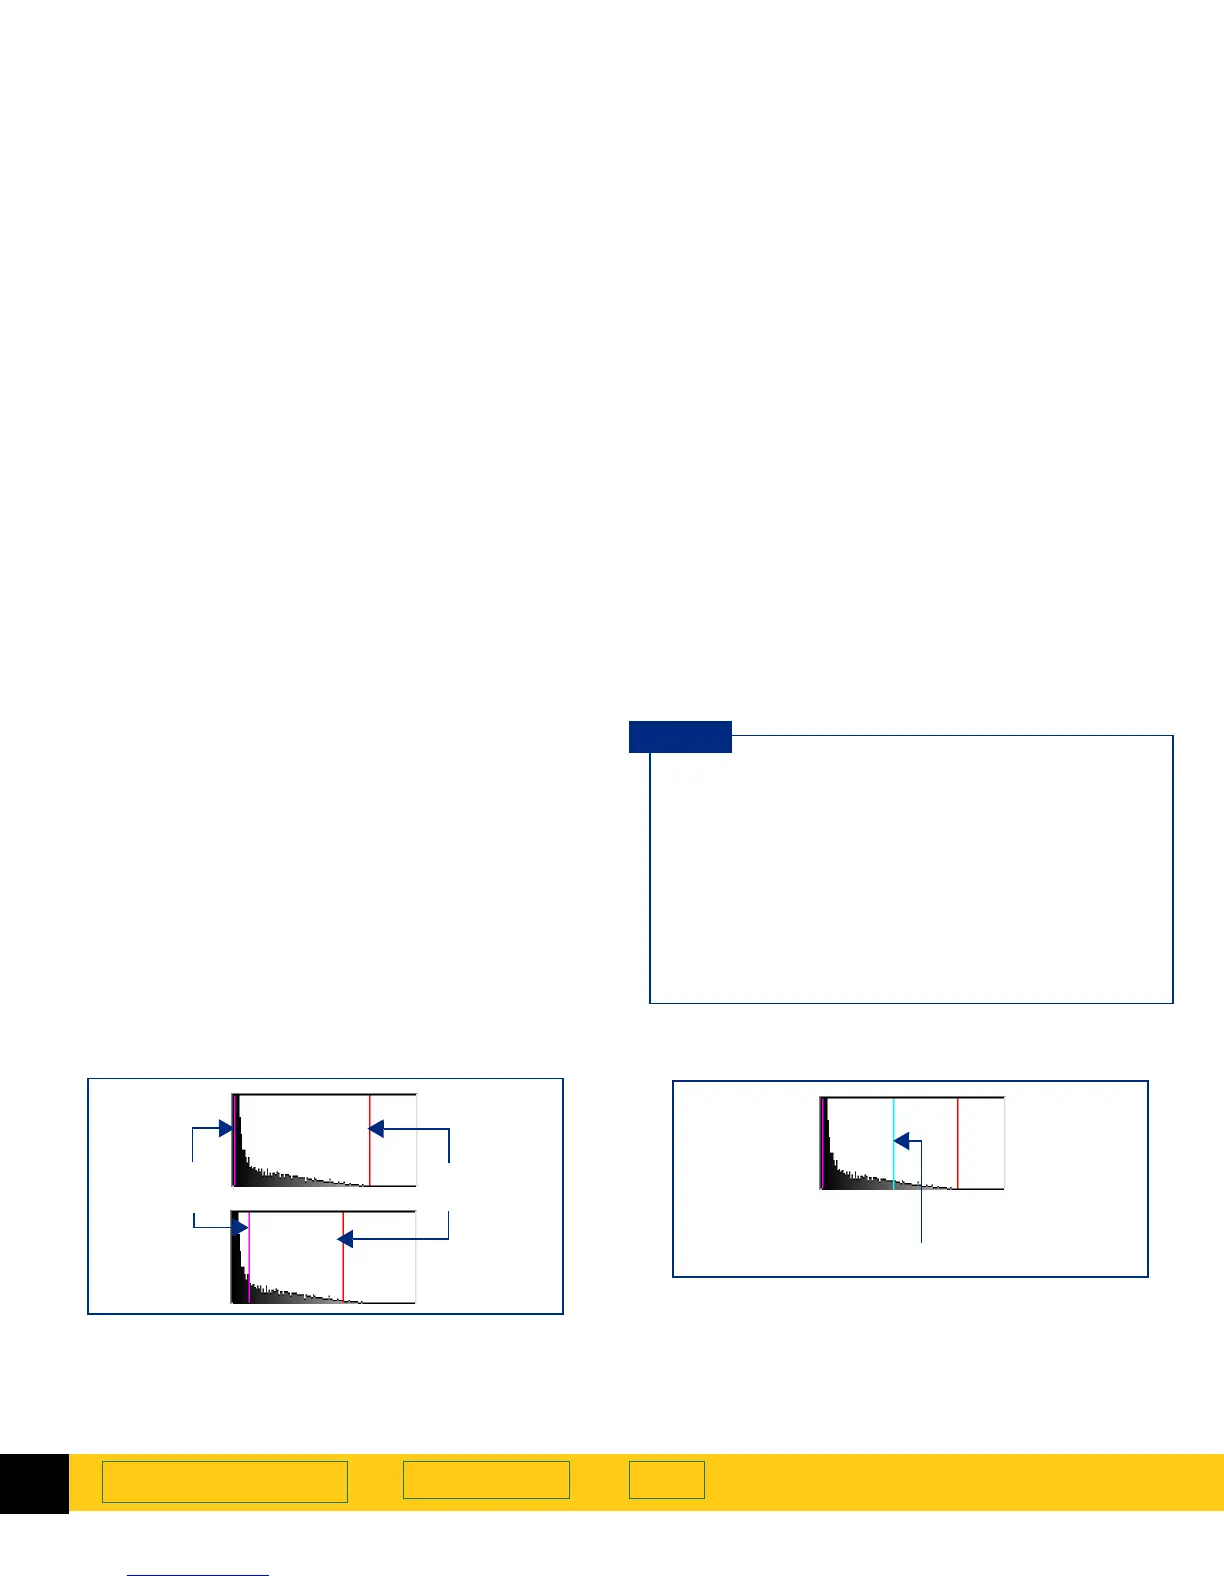
➌
The turquoise line appears in the histogram when
either eyedropper pointer is positioned over the
image. It shows you where the pixels at that place in
the image occur in the histogram.
■
Changing the settings for
Highlights
and
Shadows
does not change the graph in the
histogram.
■
Changing the selection area changes the graph
in the histogram.
■
The
Midtones
setting is not represented in the
histogram.
■
The graph in the histogram represents pixel
distribution in the input image, not in the image
that will be output.
TIP
Shadows Highlights
➊➋
Pixels under the eyedropper pointer
➌