Temperature Graphs Screen 91
User Guide v 1.0 — February 2020 Mold Diagnostics
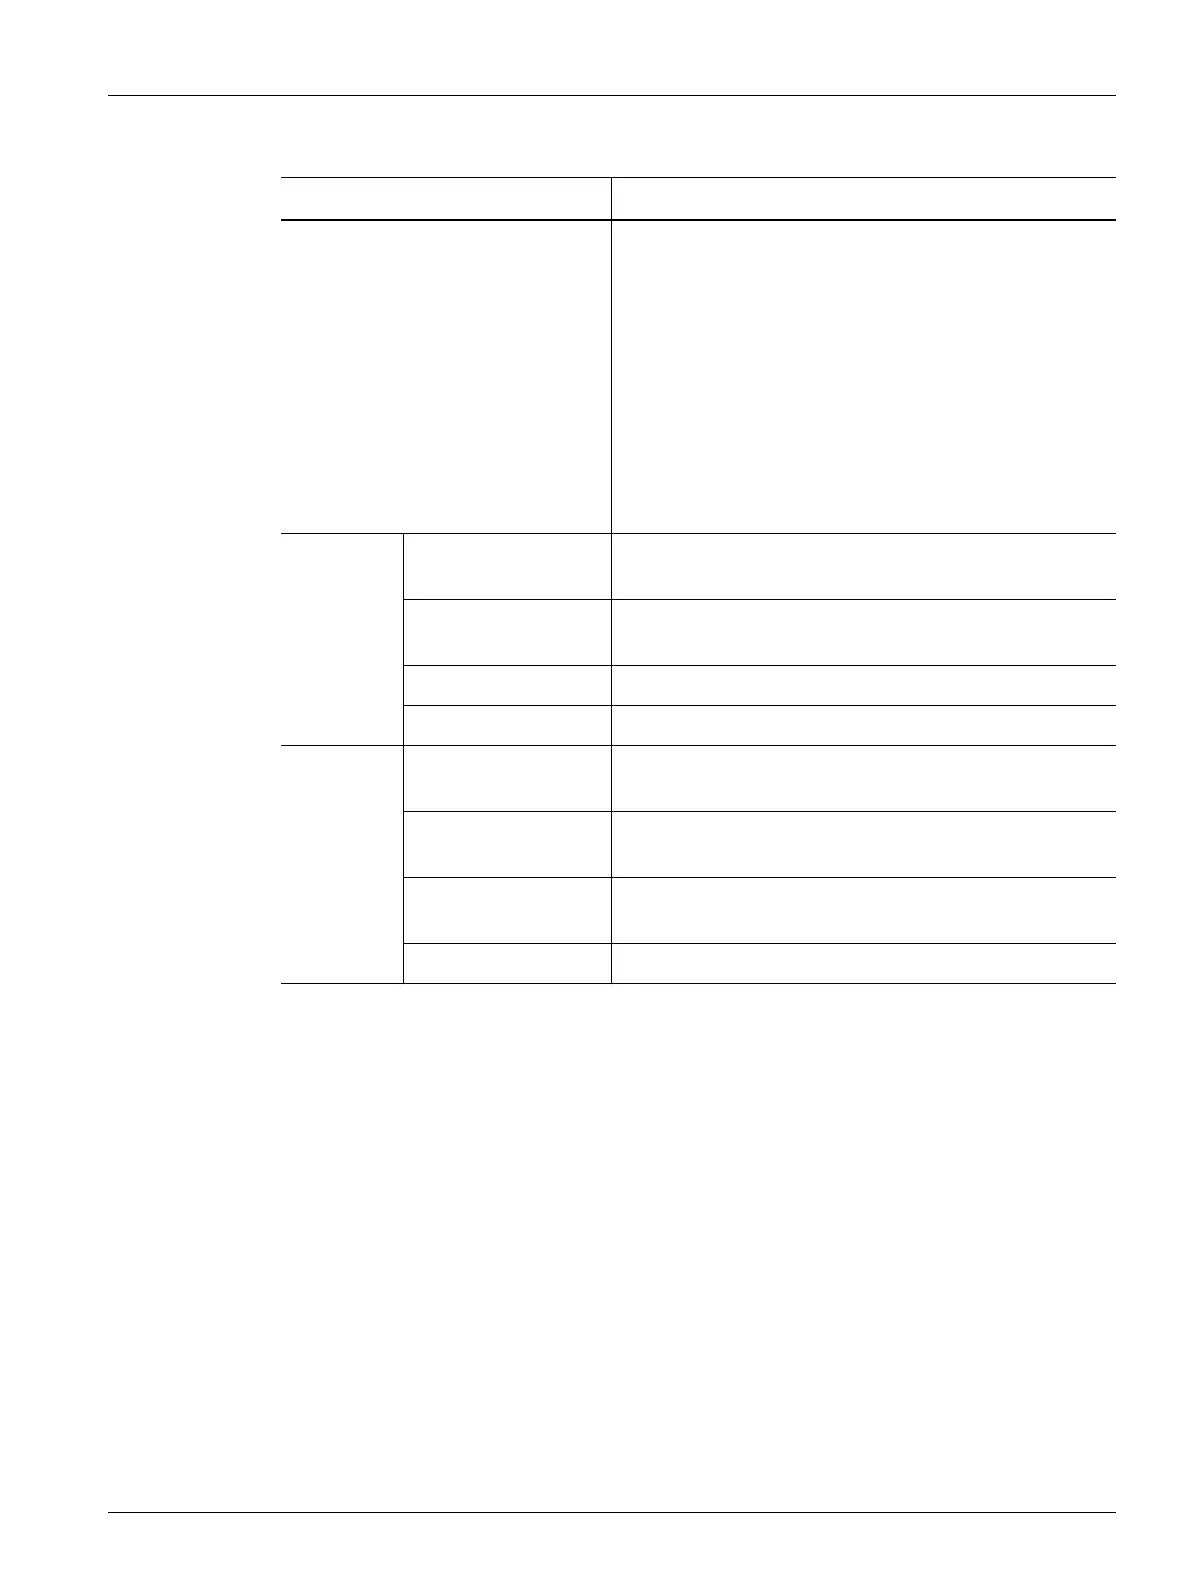
Table 8-6 Temperature Graphs Screen Indications
Item Description
Temperature Graph Area The temperature graph area shows the recorded
temperature rise during the test period for the selected
zone. Touch the graph line to display the temperature and
status of the location touched.
• The purple trace line in the graphic area of the screen
shows the zone temperature information during the
Heat Up and Cool Down stages of the test.
• The grey trace lines in the graphic area of the screen
show the other zones that you selected. Touch the
Previous Arrow and Next Arrow buttons to see the
temperature test results for those zones.
Heat Up Starting Temperature The temperature of the zone at the start of the heat up
stage of the test.
Ending Temperature The temperature of the zone when the zone completed the
heat up stage of the test.
Total Increase The increase in temperature of the zone as it was heated.
Time Duration The time to heat the zone.
Cool Down Starting Temperature The temperature of the zone at the start of the cool down
stage of the test.
Ending Temperature The temperature of the zone at the end of the cool down
stage of the test.
Total Decrease The decrease in temperature of the zone during the cool
down stage.
Time Duration The time to cool the zone.