Chapter 6
Using LANTEK REPORTER
6-35
GRAPH Button
The GRAPH button may or may not be enabled, depending on whether graph data
was saved during the uploading process of the test results. If it is enabled, you can
select this button to view graphs of individual test results performed.
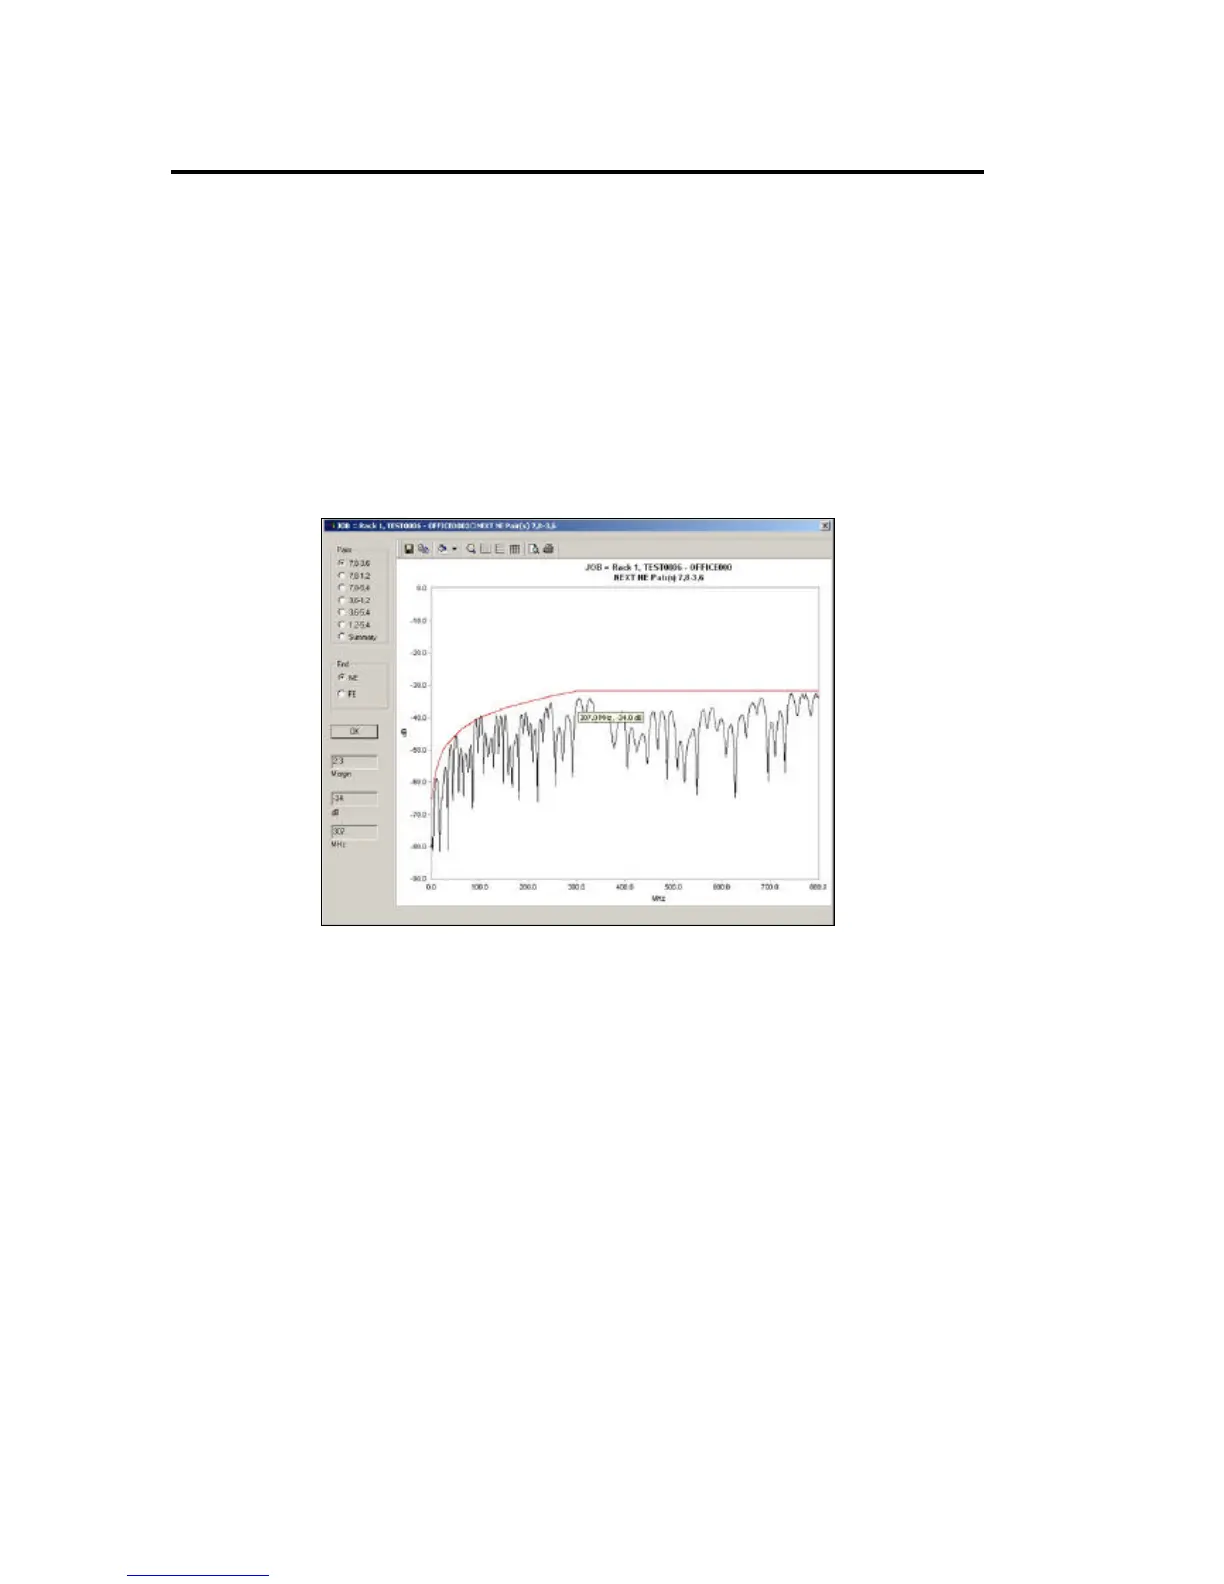
The Graph Display
The graphical data display, depending upon the test tab that has been clicked,
provides radio buttons on the left side to select the pair and/or the test reference
site of the graphed data.
• The window displays the test result data over the plot area.
• The small popup window shows the frequency and dB value of the data point
at the cursor.

 Loading...