Thermal/Mechanical Specifications and Design Guide 101
Thermal Solutions
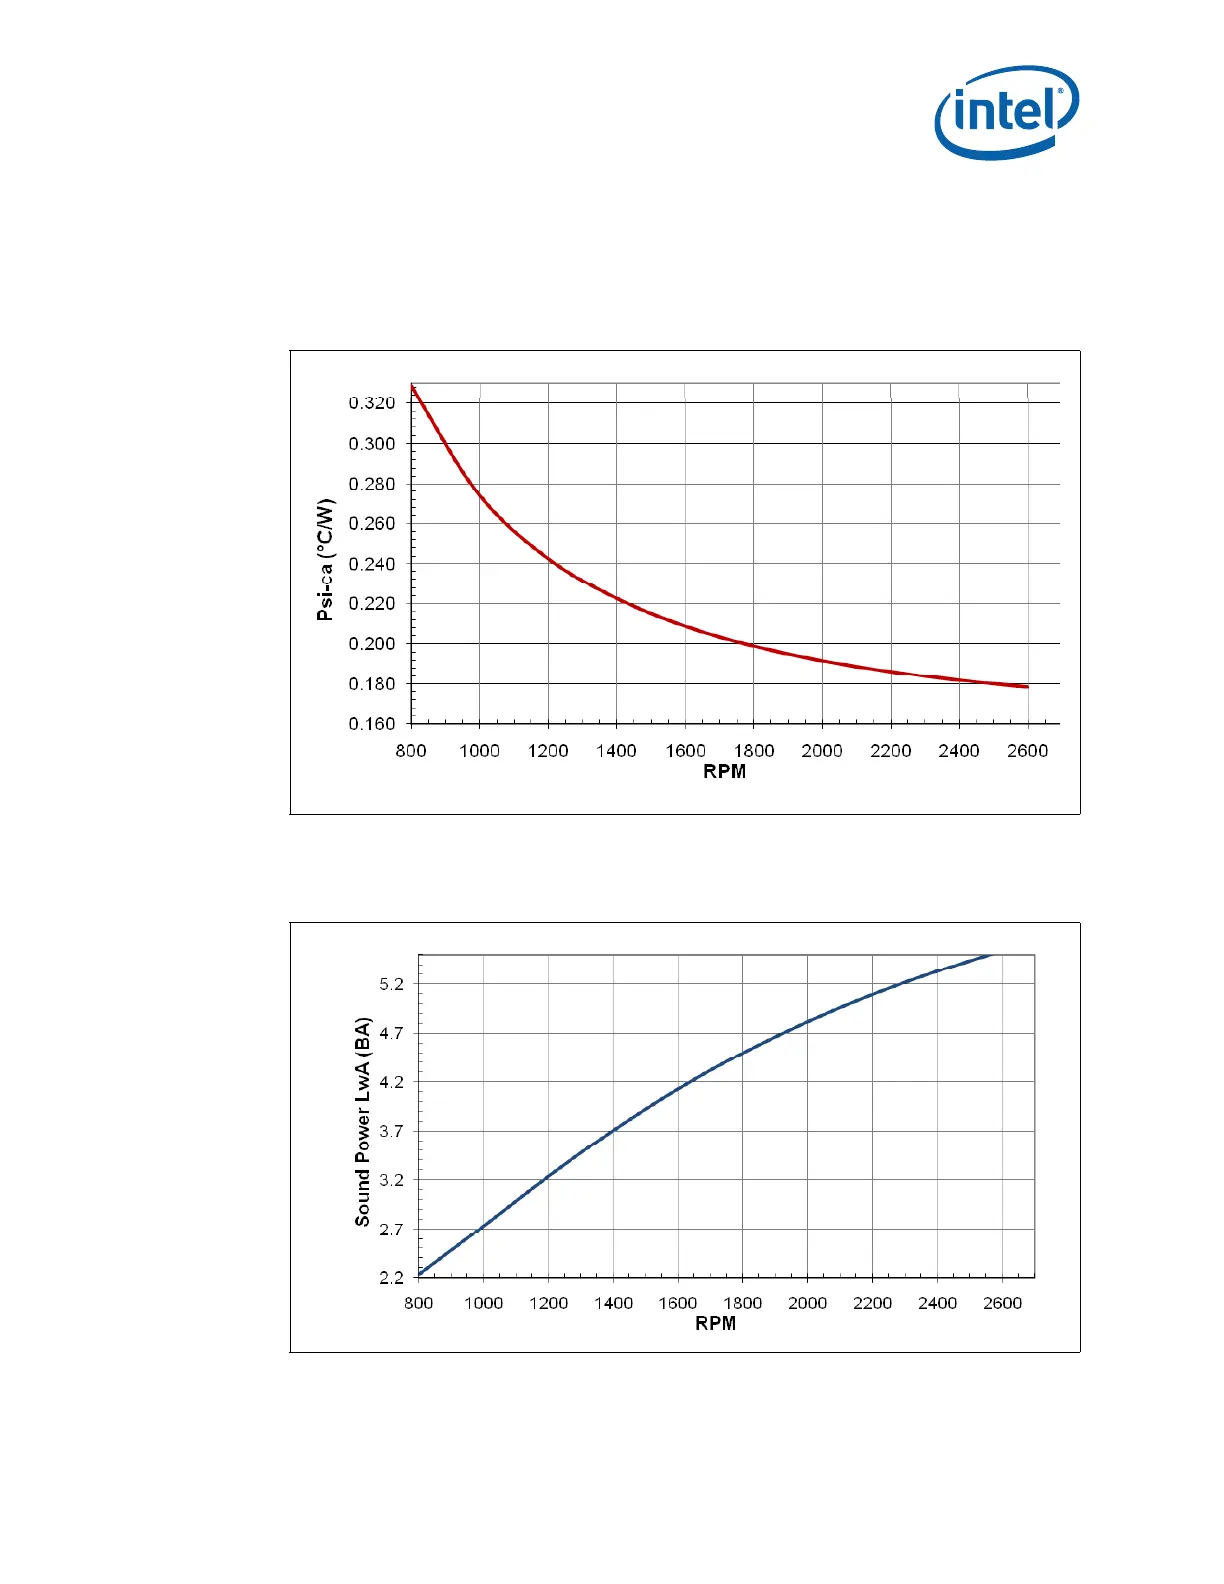
8.7 Tall Heat Pipe Heat Sink Performance
Intel has completed the initial engineering validation for the T-HPHS. The following two
figures show the Psi-ca versus RPM Figure 8-4 and Sound Power (BA) versus RPM
Figure 8-5.
Notes:
1. The target Psi-ca of 0.199 °C / W is at approximately 1800 RPM
2. The curve fit equation for this graph is Psi_ca = 0.151953 + 12740.97 * (rpm)^ (-1.67502)
Notes:
1. The curve fit equation for this graph is BA = 1.423465 + 0.042135 * (rpm)^ (-2.65664)
Figure 8-4. T-HPHS Psi-ca versus RPM
Figure 8-5. T-HPHS Sound Power (BA) versus RPM

 Loading...