Chapter 4 TheAnalysisModule 59
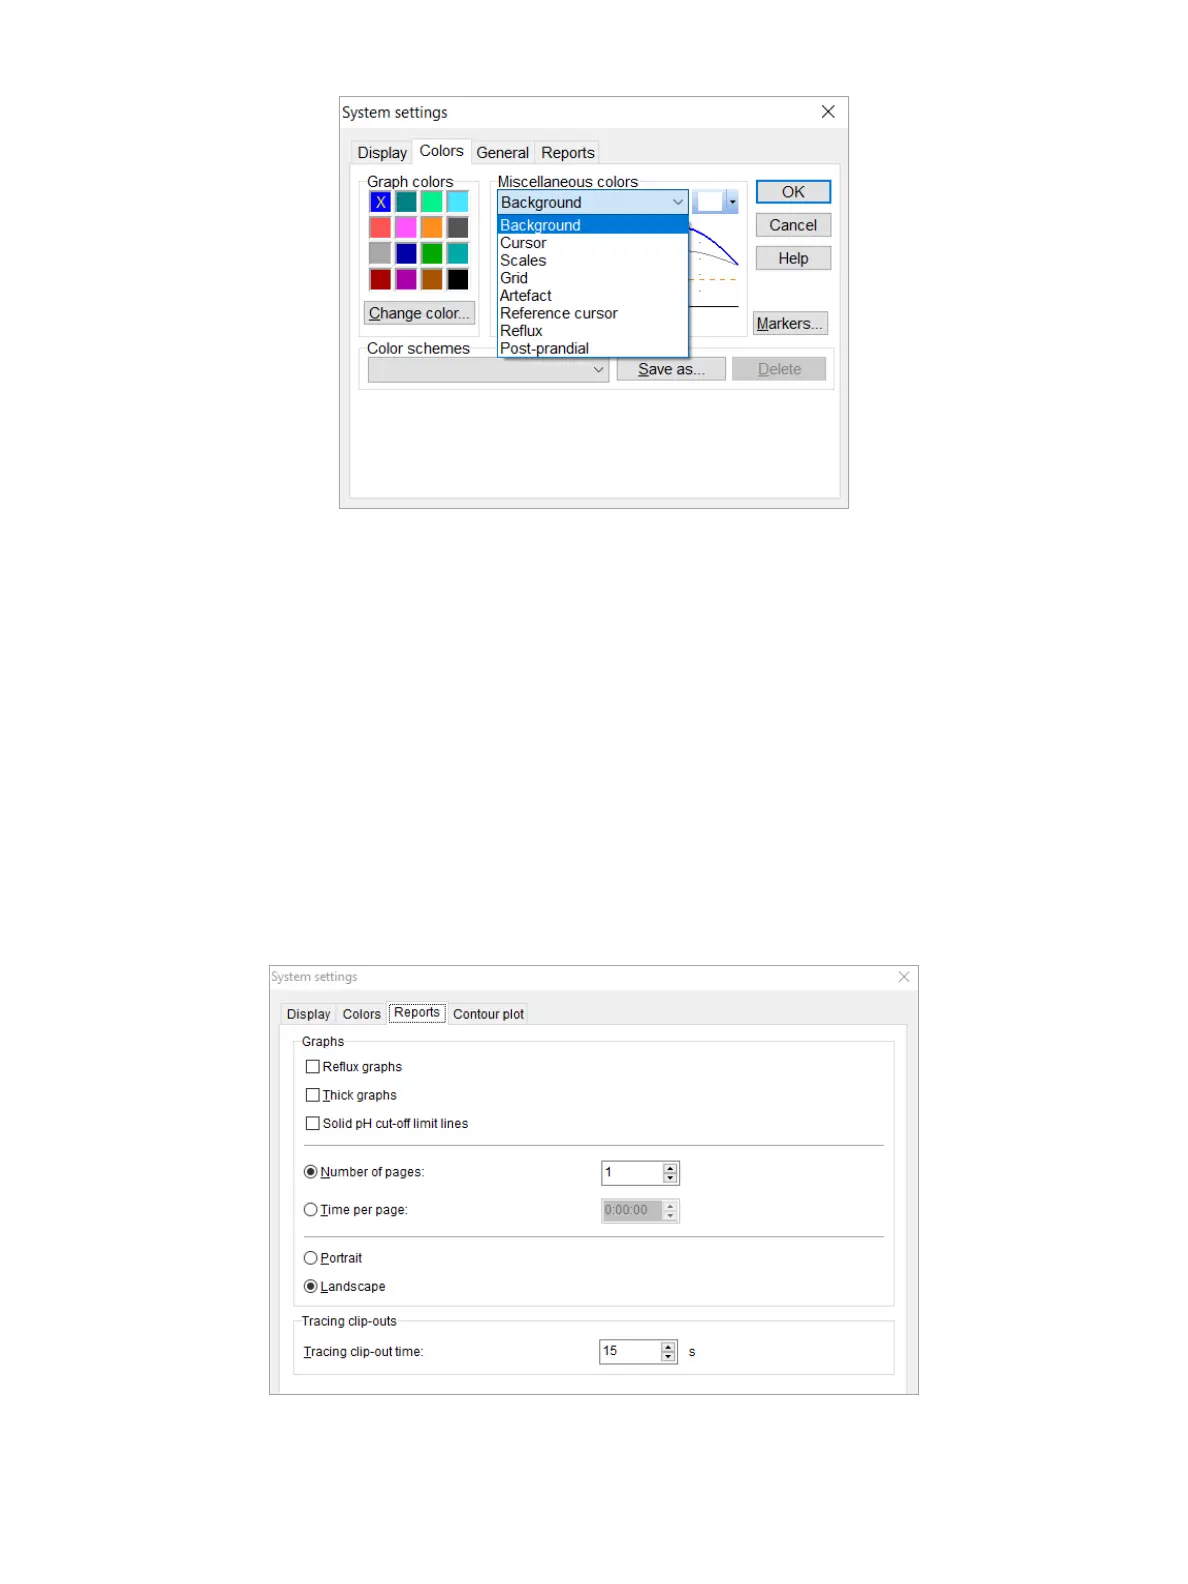
Figure4-25: System Settings Dialog Box—Colors Tab
Youcanalsochangethecolorsofotheritems.Forexample,thebackgroundcolorcanbechangedintowhiteorblack.
Or, you can change the color of scales, the grid, or the mouse pointer. You can save color schemes for use in other
investigations.
Report Tab
On the Report tab (Figure4-26),youcancongurethefollowing:
•
SelectReuxgraphs.Bythisoptionitispossibletoprintthereuxes,whichhavebeenmarkedinthe
investigation.BeforetheLaboriereporterisstarted,adialogisdisplayedtoselectthereuxgraphs.
•
Selectthickgraphs.
•
Select settings for graphs on multiple pages: set the number of pages, time per page and select portrait/
landscape.
•
Set the tracing clip-out time. By this option it is possible to print the graphs of interesting investigation periods
in the report. Via the menu option Marker > Insert marker, it is possible to insert chained Tracing clip-out
markers.Thegraphsbetweenthesemarkerswillbeprintedinthereport.
Figure4-26: System Settings Dialog Box—Report Tab