60 Laborie alpHaONE User & Service Manual LBL-01791 [B]
Contour Plot Tab
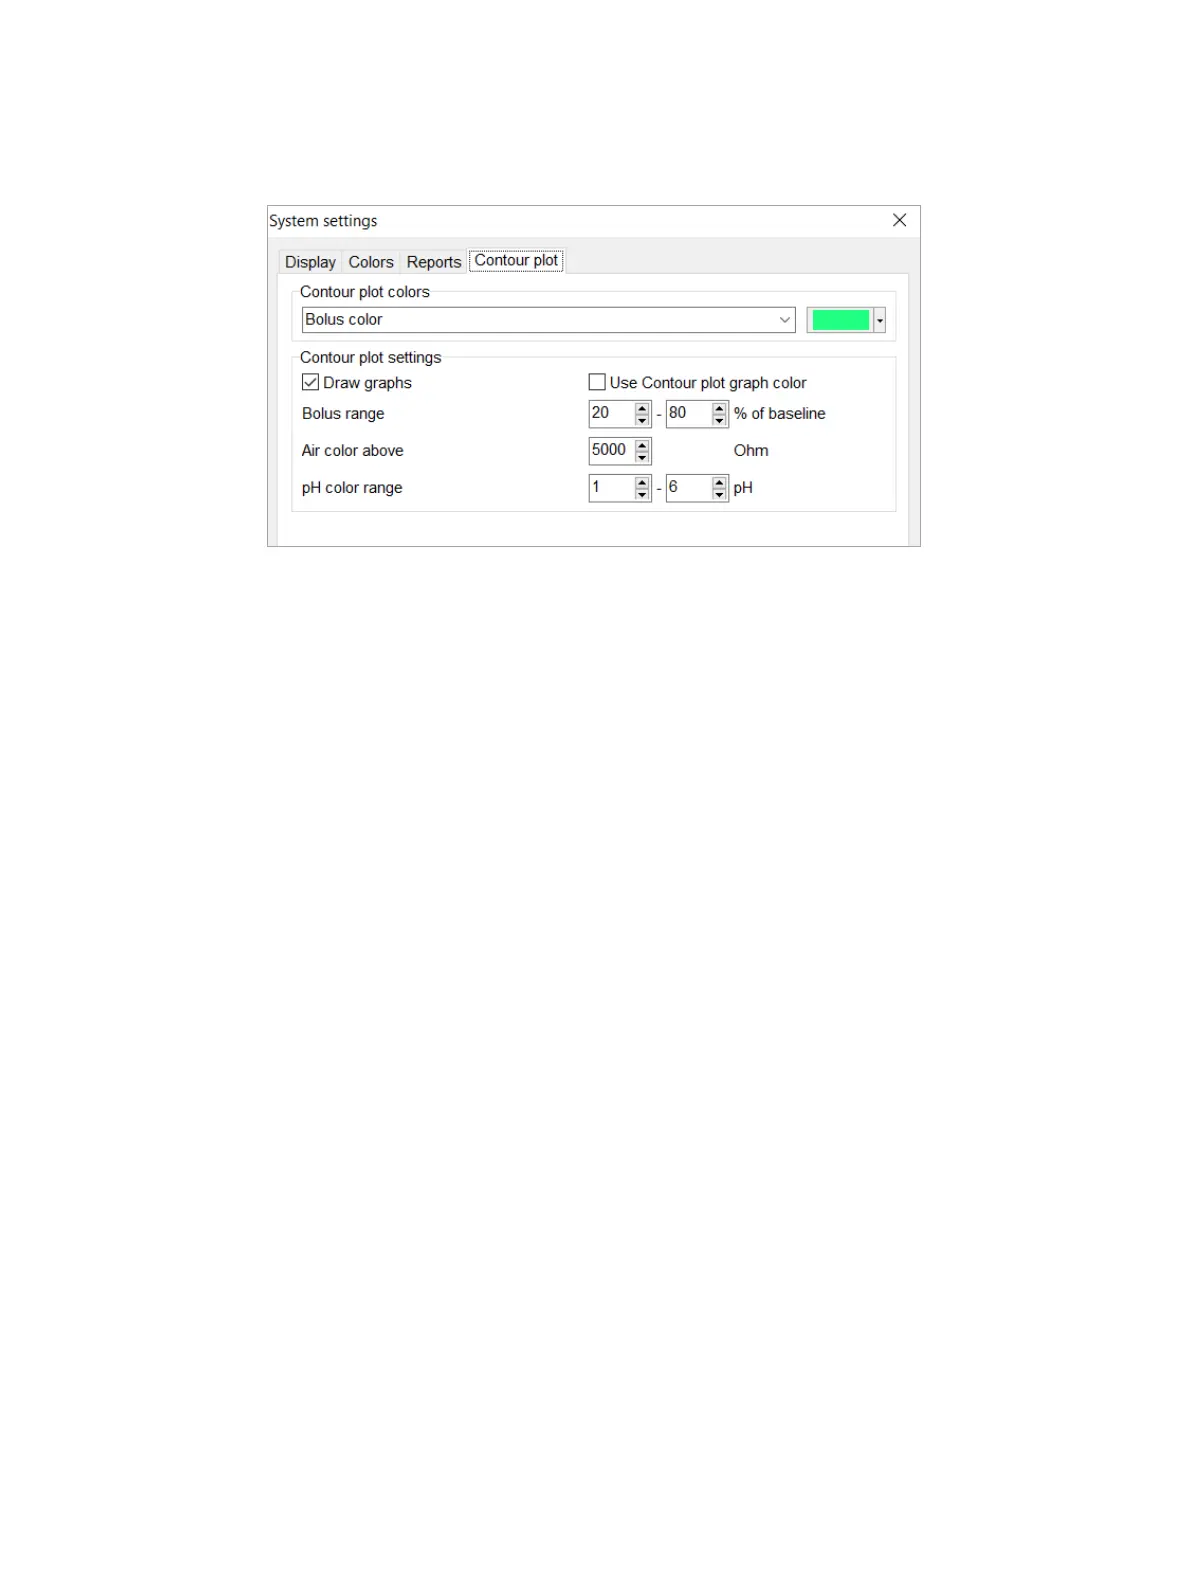
Select the Contour plot tab, shown in Figure4-27, to adapt the contour plot colors or contour plot settings (for more
information about contour plots, see the section “Introduction” on page 41).
Figure4-27: System Settings Dialog Box—Contour Plot Tab
In the Contour plot colors section, you can change the color of the contour plots.
The default colors are:
•
Bolus color: green
•
Aircolor:blue
•
pH color: red
•
Contourplotgraphcolor:black
In the Contour plot section, you can set the following:
•
Draw graphs (default = on): select this option to display the pH graph on the contour plots
•
UseContourplotgraphcolor(default=off):selectthisoptiontousethesamecolorforallgraphs,asdenedin
thesectionabove(default=black).
•
pH color range: all pixels with a pH value between 6 and 1 (default setting) will have a color tone between
backgroundcolorandpHcolor.PixelswithapHvalueof6willhavebackgroundcolor.PixelswithapHvalue
of1willhavepHcolor.
pH Analysis Settings
TochangethepHanalysissettingsforthereuxandalkalinereuxdetection,onthemenubar,chooseSettings >
Analysis settings and then select the pH tab, as illustrated in Figure4-28.