Version 1.9 Page 155 of 170
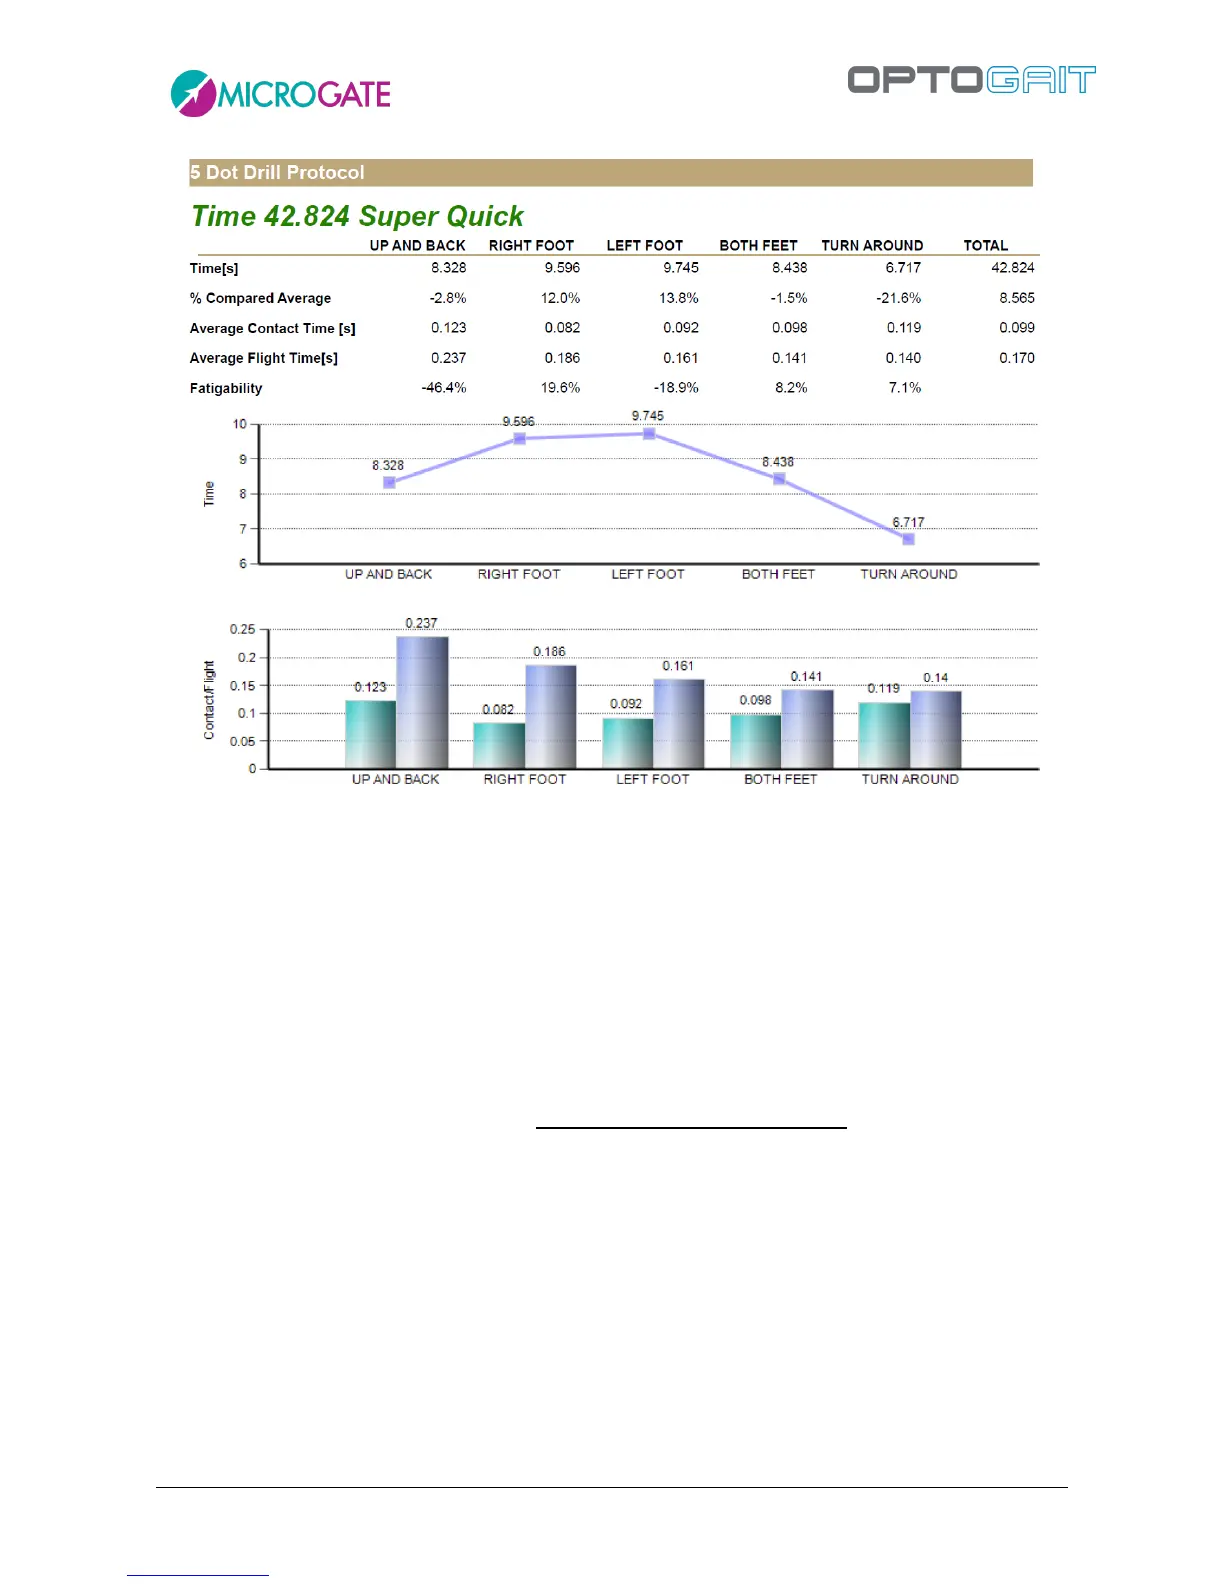
Figure 130 - 5 Dot Drill report output
The parameter '% Compared average' is calculated as difference between the average of all 5 tests
and the average value of each single test.
E.g. for Up & Back: (8.328 – 8.565) / 8.328
The fatigability index is calculated using the average of the first 6 contact time values and
compared to the average value of the last 6 contact times.