l
Client counts for the channel are shown in
green near the top of the column for each
channel. In the example below, Channel 161
has 15 clients.
l
Tap a Channel's column on the Map or Map
6E graph to select and highlight the channel.
This displays the CHANNEL DETAILS and
SPECTRUM links at the bottom of the screen.
In the example below, Channel 161 is
highlighted.
The Channel Details screen lets you examine
the addresses and devices operating on the
channel and perform a deeper analysis.
The Spectrum link opens the Spectrum app,
a Wi-Fi spectrum analyzer that provides data
about signal strength and noise.
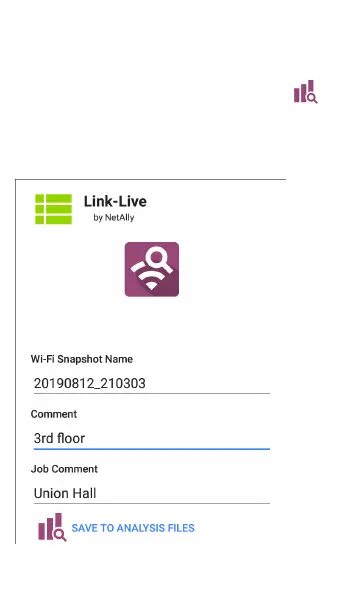
Wi-Fi Analysis App
500
 Loading...