Home
netAlly
Measuring Instruments
AirCheck G3
Page 538
netAlly AirCheck G3 - Page 538
711 pages
Manual
To Next Page
To Next Page
To Previous Page
To Previous Page
Loading...
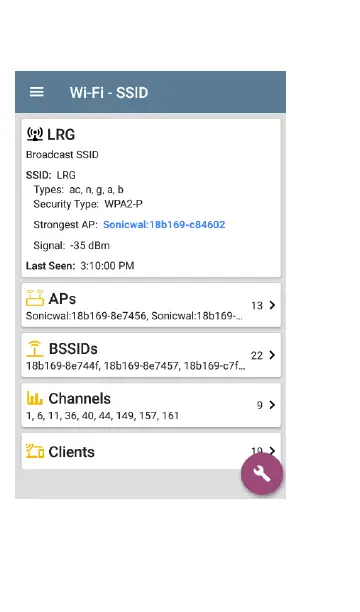
See
RF
and
Traffic
Statistics
Overview
in
the
Wi-
Fi
Details
Screens
topic
for
an
explanation
of
the
common
elements
of
this
screen.
The
Signal
graph
shows
the
signal
in
light
blue,
noise
in
dark
blue,
and
a
calculated
SNR.
Wi-Fi
Analysis
App
538
537
539
Table of Contents
Main Page
Table of Contents
2
Contact Us
14
Introduction
15
How to Use this Guide
16
Differences between Models
20
Buttons and Ports
22
Charging and Power
25
Safety and Maintenance
27
Legal Notification
30
Home and System Interface
31
Home Screen
32
Navigating the System
34
System Status Bar and Notifications
38
Notification Panel
38
Apps Screen and Store
41
Device Settings
45
Quick Settings Panel
46
Connecting to Wi-Fi
50
Captive Portals
53
Configuring for Enterprise Security
54
Sharing
63
Sharing a Screenshot
66
Changing the Device Language
69
Cyberscope Air Settings and Tools
71
Navigation Drawer
72
About Screen
73
Exporting Logs
74
Import/Export for All Apps
74
Restarting the Test Unit
75
Test and Management Ports
76
Test Ports
77
Selecting Ports
83
Test and Port Status Notifications
85
Test Port Notifications
86
Management Port Notifications
87
Discovery Notifications
88
Vnc/Link-Live Remote
88
Cyberscope Air General Settings
90
Wi-Fi
91
Management
95
Preferences
98
Trending Graphs
99
Common Icons
103
Common Tools
106
Web Browser/Chromium
106
Telnet/Ssh
106
External Camera
107
Software Management
111
Managing Files
112
Files Application
112
How to Move or Copy a File
115
Using a USB Drive
115
Ejecting Storage Media
117
Updating Software
120
Remote Access
125
Using VNC
126
Using Link-Live Remote
127
Managing Netally App Settings
129
Resetting Testing App Defaults
129
Saving App Settings and Configurations
134
Import/Export Settings
138
Import/Export Settings for All Apps
148
Resetting Cyberscope Air Factory Defaults
150
Cyberscope Air Feature Access
153
Introduction to Cyberscope Air Feature Access
154
Controlling Feature Access
161
Permanently Disabling Features
167
Changing the Administrative Password173
173
Cyberscope Air Testing Applications
176
Autotest App and Profiles
177
Autotest Overview
179
Managing Profiles and Profile Groups
182
Factory Default Profiles
182
Adding New Profiles
183
Profile Groups
189
Creating New Profile Groups
194
Import/Export Autotest Profiles
197
Main Autotest Screen
198
Periodic Autotest
200
Periodic Autotest Settings
200
Running Periodic Autotest
202
Wi-Fi Autotest Profiles
205
Wi-Fi Profile Results
209
Wi-Fi Link Test Results
212
Connect Log
220
Channel Test Results
221
Wi-Fi Profile FAB
227
Wi-Fi Profile Settings
231
Wi-Fi Connection Settings
233
Advanced (Wi-Fi Connection) Settings
244
Channel Test Settings
247
HTTP Proxy
250
DHCP, DNS, and Gateway Tests
252
DHCP or Static IP Test
253
DNS Test
266
Test Targets for Wi-Fi Autotest
277
Adding and Managing Test Targets
278
Autotest TCP Connect Test
291
FTP Test
309
Air Quality Autotest Profiles
319
Air Quality Profile Results
321
Air Quality Profile FAB
326
Air Quality Profile Settings
327
Nmap App
332
Nmap Tests
336
Nmap Output
353
Discovery App
361
Introduction to Discovery
363
Main Discovery List Screen
365
Searching the Discovery List
368
Filtering the Discovery List
370
Sorting the Discovery List
373
Security Auditing - Batch Authorization
375
Refreshing Discovery
380
Uploading Results to Link-Live
381
Discovery Details Screens
383
Top Details Card
385
Lower Cards in Device Details
391
Problems
393
Addresses
394
TCP Port Scan
396
Vlans
398
Interfaces
399
Snmp
405
Connected Devices
406
Resources
407
Ssids
408
Discovery App Floating Action Menu
410
Device Types
417
Routers
418
Switches
419
Unknown Switches
420
Network Servers
421
Hypervisors
422
Virtual Machines
423
Wi-Fi Controllers
424
Access Points (Aps)
425
Wi-Fi Clients
426
Voip Phones
427
Printers
428
SNMP Agents
429
Network Tools
430
Hosts/Clients
431
Device Names and Authorization
434
Assigning a Name and Authorization to a Device
434
Discovery Settings
447
Active Discovery Ports
450
Extended Ranges
451
ARP Sweep Rate
455
Refresh Interval
455
SNMP Configuration
456
Nmap Tests
467
Auto AP Grouping Rules
468
Problem Settings
476
TCP Port Scan Settings
479
Wi-Fi Analysis App
482
Wi-Fi Analysis and Discovery
484
Wi-Fi App Screens
485
Wi-Fi App List Screens
486
Filtering in the Wi-Fi App
490
Sorting in the Wi-Fi App
495
Clearing All Problems
497
Setting Authorization
498
Uploading Results to Link-Live
499
Wi-Fi Details Screens
501
Wi-Fi Problems Screen
504
RF and Traffic Statistics Overview
506
Locating Wi-Fi Devices
511
Channels Map
522
Map and Map 6E Tabs
523
Channels
531
Ssids
536
Aps
541
Bssids
545
Clients
558
Bluetooth
567
Airmapper™ App
572
Airmapper Settings
573
Configuring an Airmapper Survey
574
Collecting Airmapper Data
583
Starting a New Survey
595
Path Analysis App
596
Introduction to Path Analysis
597
Path Analysis Settings
598
Populating Path Analysis from Another App
598
Configuring Path Analysis Manually
598
Running Path Analysis
601
Path Analysis Results and Source Cyberscope Air Cards
602
Layer 3 Hops
605
Layer 2 Devices
610
Uploading Results to Link-Live
616
Spectrum Test App
618
Using the Spectrum Views
619
Uploading Results to Link-Live
627
Spectrum Settings
629
Changing Spectrum Views
629
Saving Settings
629
Changing Spectrum Settings
630
Ping/Tcp Test App
633
Ping/Tcp Settings
634
Populating Ping/Tcp from Another App
634
Configuring Ping/Tcp Settings Manually
636
Running Ping/Tcp Tests
639
Capture App
643
Capture Settings
644
Running and Viewing Captures
649
Link-Live Cloud Service
654
Getting Started in Link-Live Cloud Service
656
Claiming the Unit
656
After Claiming
658
Unclaiming
659
Allycare Code
660
Private Link-Live Settings
660
Link-Live App Features
661
Saving Locally Only
665
Job Comment
667
Link-Live and Testing Apps
670
Link-Live Sharing Screens
671
Sharing a Text File to Link-Live
674
Iperf Test App
677
Iperf Settings
679
Saving Custom Iperf Settings
679
Test Accessories in Discovery
680
Configuring Iperf Settings
683
Running an Iperf Test
687
Uploading Results to Link-Live
691
Specifications and Compliance
693
Cyberscope Air Specifications
694
General
694
Tri-Band Wireless
695
Other manuals for netAlly AirCheck G3
Quick Start Guide
2 pages
Related product manuals
netAlly CyberScope Air
755 pages