3.5 Basic Operations
3-37 ZM2376
Table 3-3 Max. current, max. voltage, and output impedance in each measurement range
Maximum current
(Detection)
50m / 12mArms
(Rd= 100 / 25, 6 Ω)
5 / 1.2 Vrms
(Rd= 100 / 25, 6 Ω)
5 / 1.2 Vrms
(Rd= 100 / 25, 6 Ω)
50m / 200mArms
(Rd= 100, 25 / 6 Ω)
5 / 1.2 Vrms
(Rd= 100 / 25, 6 Ω)
0.5 / 1.2Vrms
(Rd= 100 / 25, 6 Ω)
5 / 1.2 Vrms
(Rd= 25 / 6 Ω)
5 / 1.2 Vrms
(Rd= 25 / 6 Ω)
The output impedances shown in bold font indicate the initial values.
The max sensing current/voltage shown in the above table are values obtained at the largest
measurement signal level for each output impedance. If the measurement signal level is
decreased, the range of detection current/voltage will be narrower.
Allowable current peak value (instantaneous value) including DC bias current (leak current) is
about 1.4 times the max sensing current (RMS value). Actually, the detection side has a margin
of 10% or more.
Rd: Output impedance
Sum of cable resistance, contact resistance, and Rd error (+) = 0.5Ω
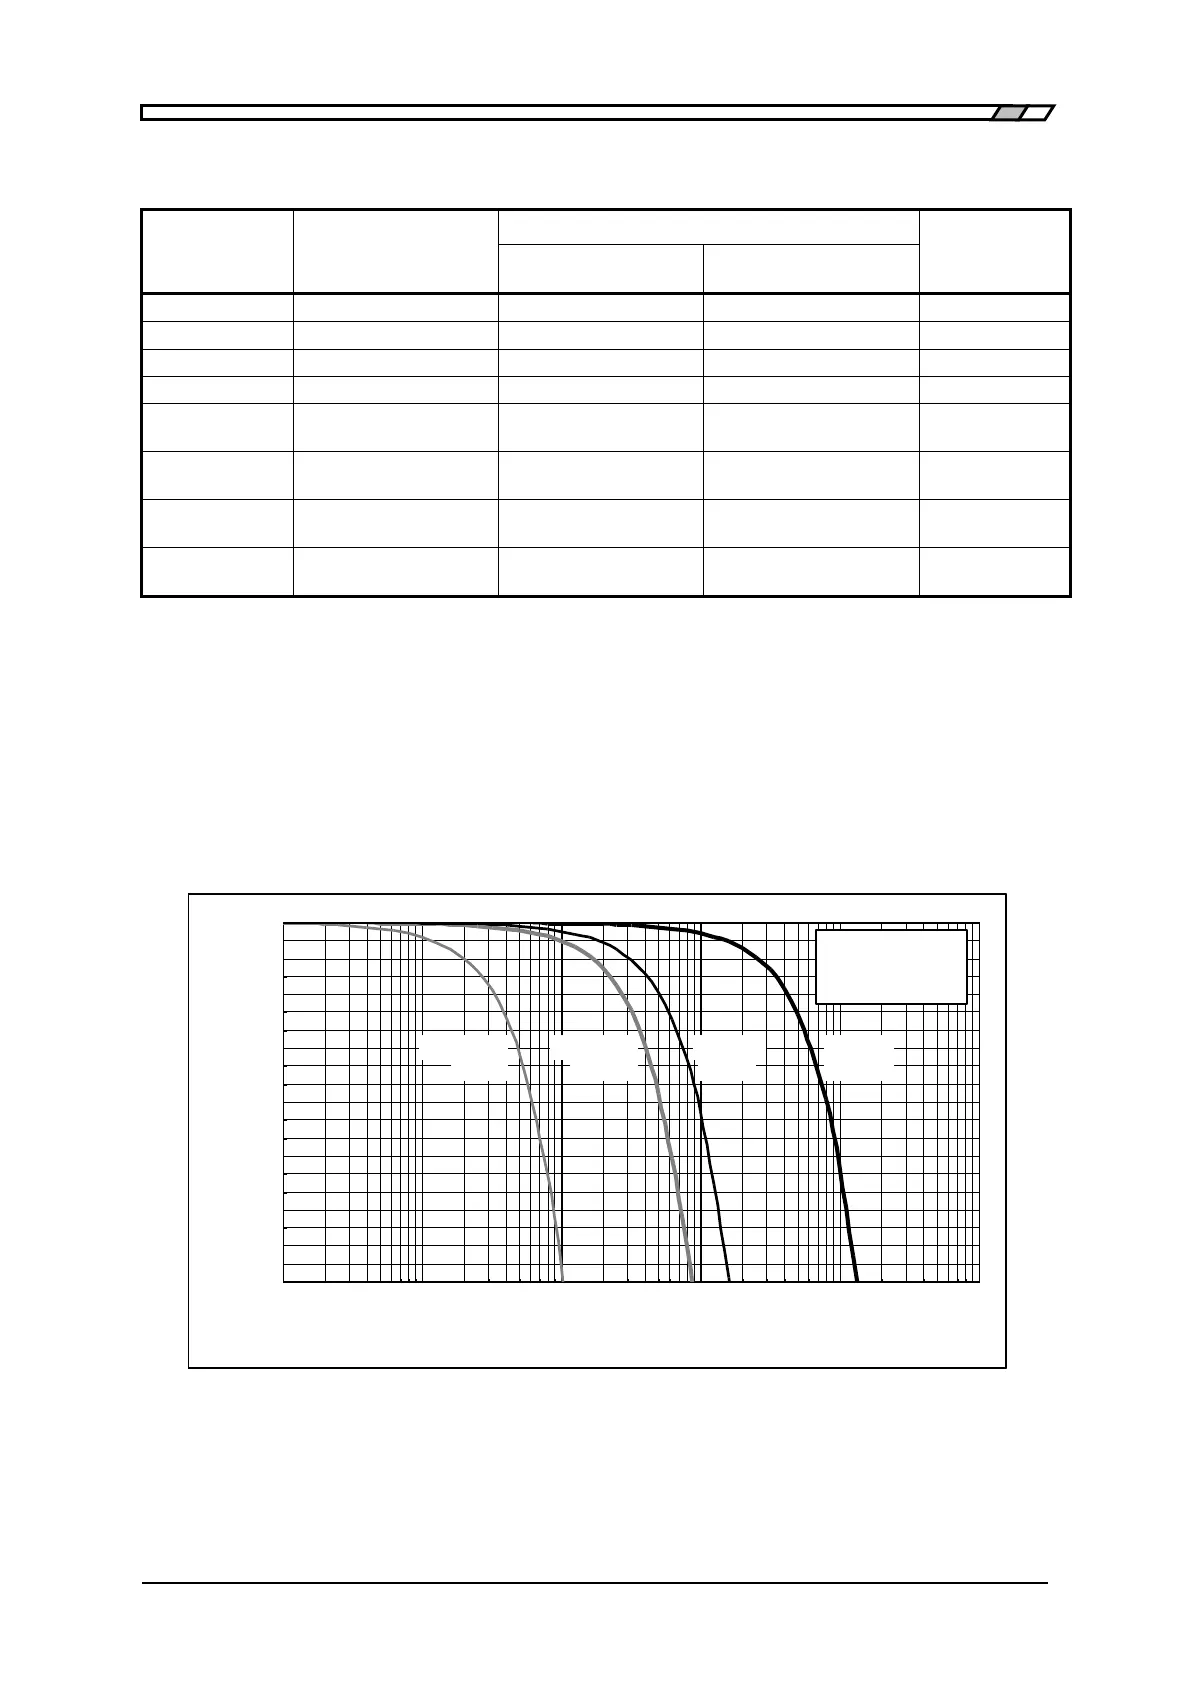
Figure 3-5 Capacitance to measurement signal level characteristics
-20
-10
0
10n 100n 1µ 10µ 100µ 1m
D = 0.1
R-cable = 0.5Ω
ALC=OFF
Signal level decreasing rate (%)