EasyManuals Logo

PerkinElmer Quantum GX2 microCT User Manual

PerkinElmer Quantum GX2 microCT
95 pages
To Next Page IconTo Next Page
To Previous Page IconTo Previous Page
Page #76 background imageLoading...
Page #76 background image
Quantum GX2 microCT Imaging System Manual Chapter 7 | Viewing Images 71
Viewing a Z-Axis Slice
1. Click the button in the Viewer.
2. Choose viewing options in the dialog box that appears and click OK (Figure 7.4).
Thickness – 2, 4, 8, 12, or 16 slices
MIP Type (intensity value of each pixel along the Z-axis that will be displayed) – Max, Min,
or Average intensity
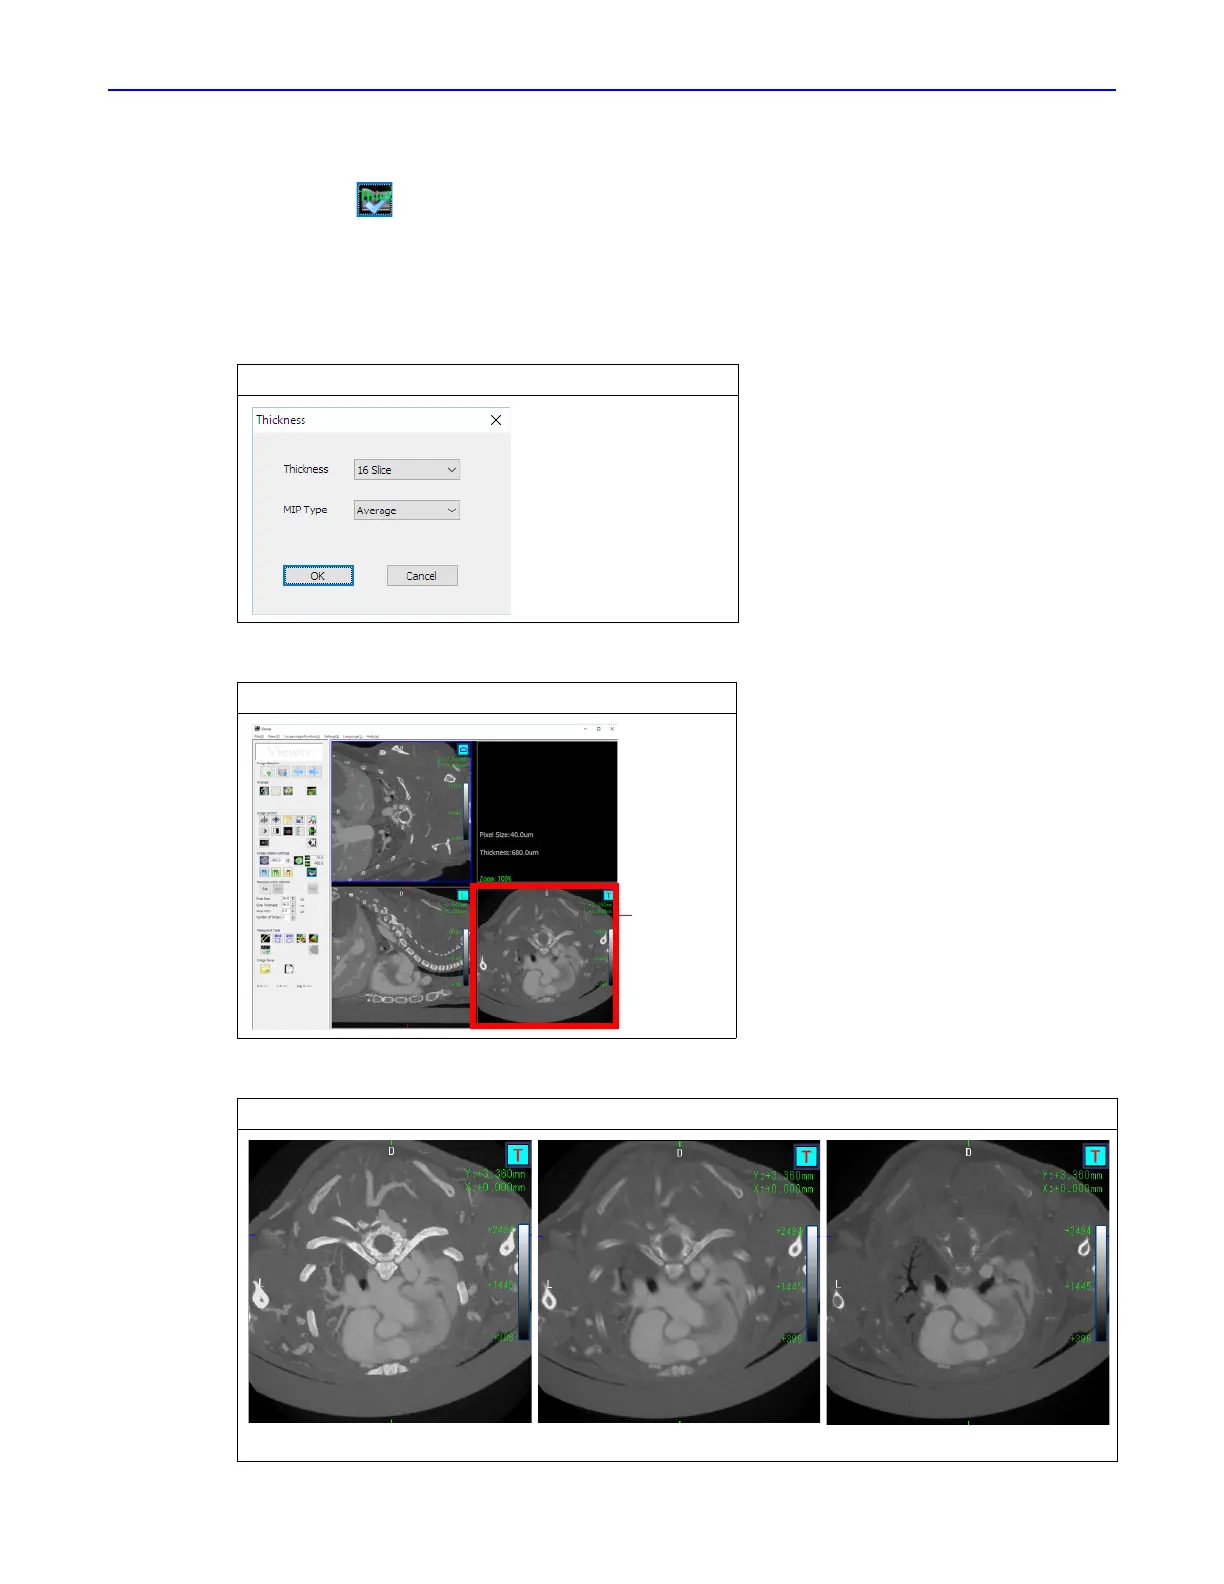
Figure 7.4 Z-axis Viewing Options
Figure 7.5 Viewer Window
Figure 7.6 Example Z-axis Slice Images
Z-axis slice
Maximum intensity Average intensity Minimum intensity

Table of Contents

Questions and Answers:

Question and Answer IconNeed help?

Do you have a question about the PerkinElmer Quantum GX2 microCT and is the answer not in the manual?

PerkinElmer Quantum GX2 microCT Specifications

General IconGeneral
BrandPerkinElmer
ModelQuantum GX2 microCT
CategoryAll in One Printer
LanguageEnglish