Quantum GX2 microCT Imaging System Manual Chapter 7 | Viewing Images 76
Classifying Image Data Using the 3D Viewer
The 3DViewer initially displays image data with a default air-noise boundary that identifies bone.
Use the volume rendering controls to create and visualize additional intensity ranges or “parts”, for
example, a particular type of soft tissue.
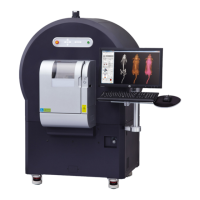
The histogram in the volume rendering controls represents the distribution of voxel intensities in the
3D reconstruction and their color-opacity values. The goal of classification is to set color and opacity
values for different intensity ranges so that regions of the volume that are of interest appear opaque
and unimportant regions are hidden (the voxels are transparent).
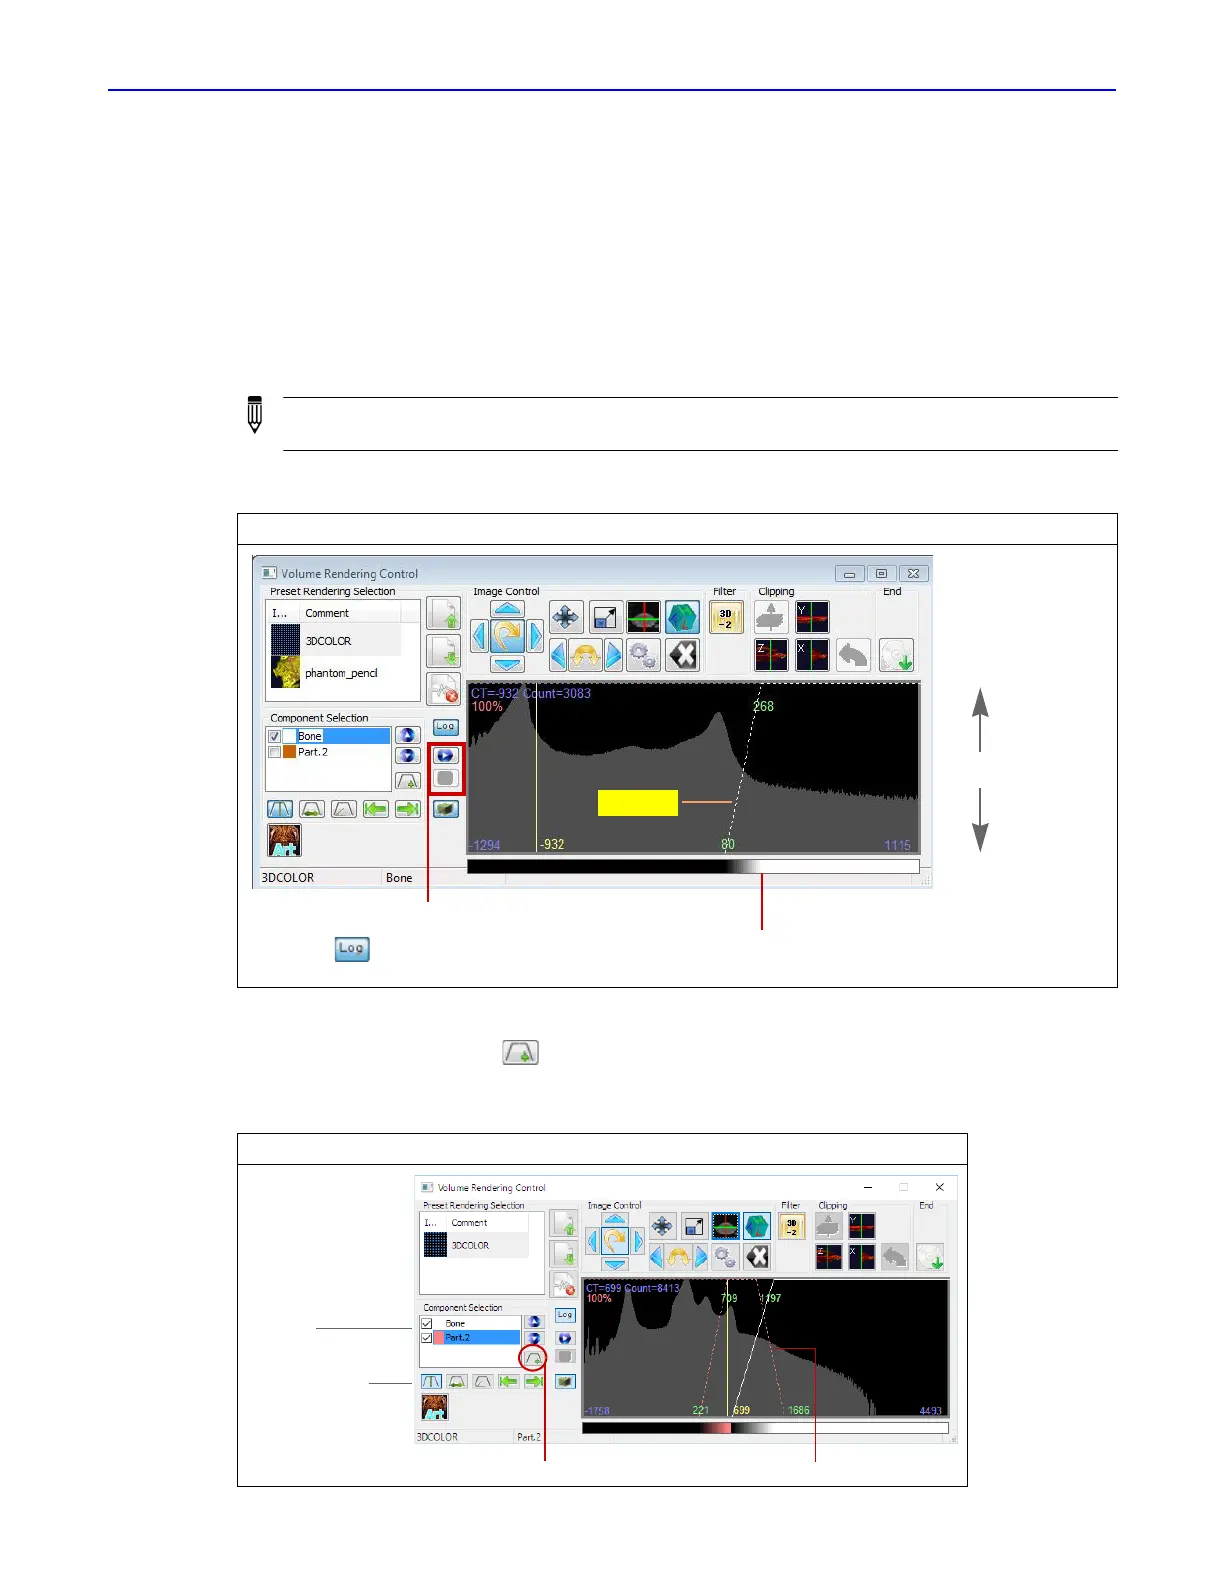
To classify a part of the data:
1.
Click the Add Part button (Figure 7.10).
A new partition appears in the histogram. The new part name is added to the part list.
NOTE: This section explains how to classify data while in segment mode. The steps are the same
in artistic mode.
Figure 7.9 Voxel Histogram
Figure 7.10 Adding a Part to the Histogram
Click to resize the histogram X-axis.
Click the button to switch the
histogram between a linear or log Y-axis.
Voxel color table and opacity
Voxel intensity
“Bone”
Part list
Partition tools
Click to add a partition New “Part 2”
 Loading...