34
Operating Instructions
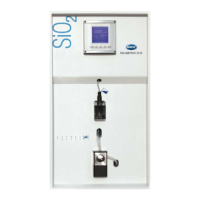
5.2.2 Display screen 2 - Measurement history
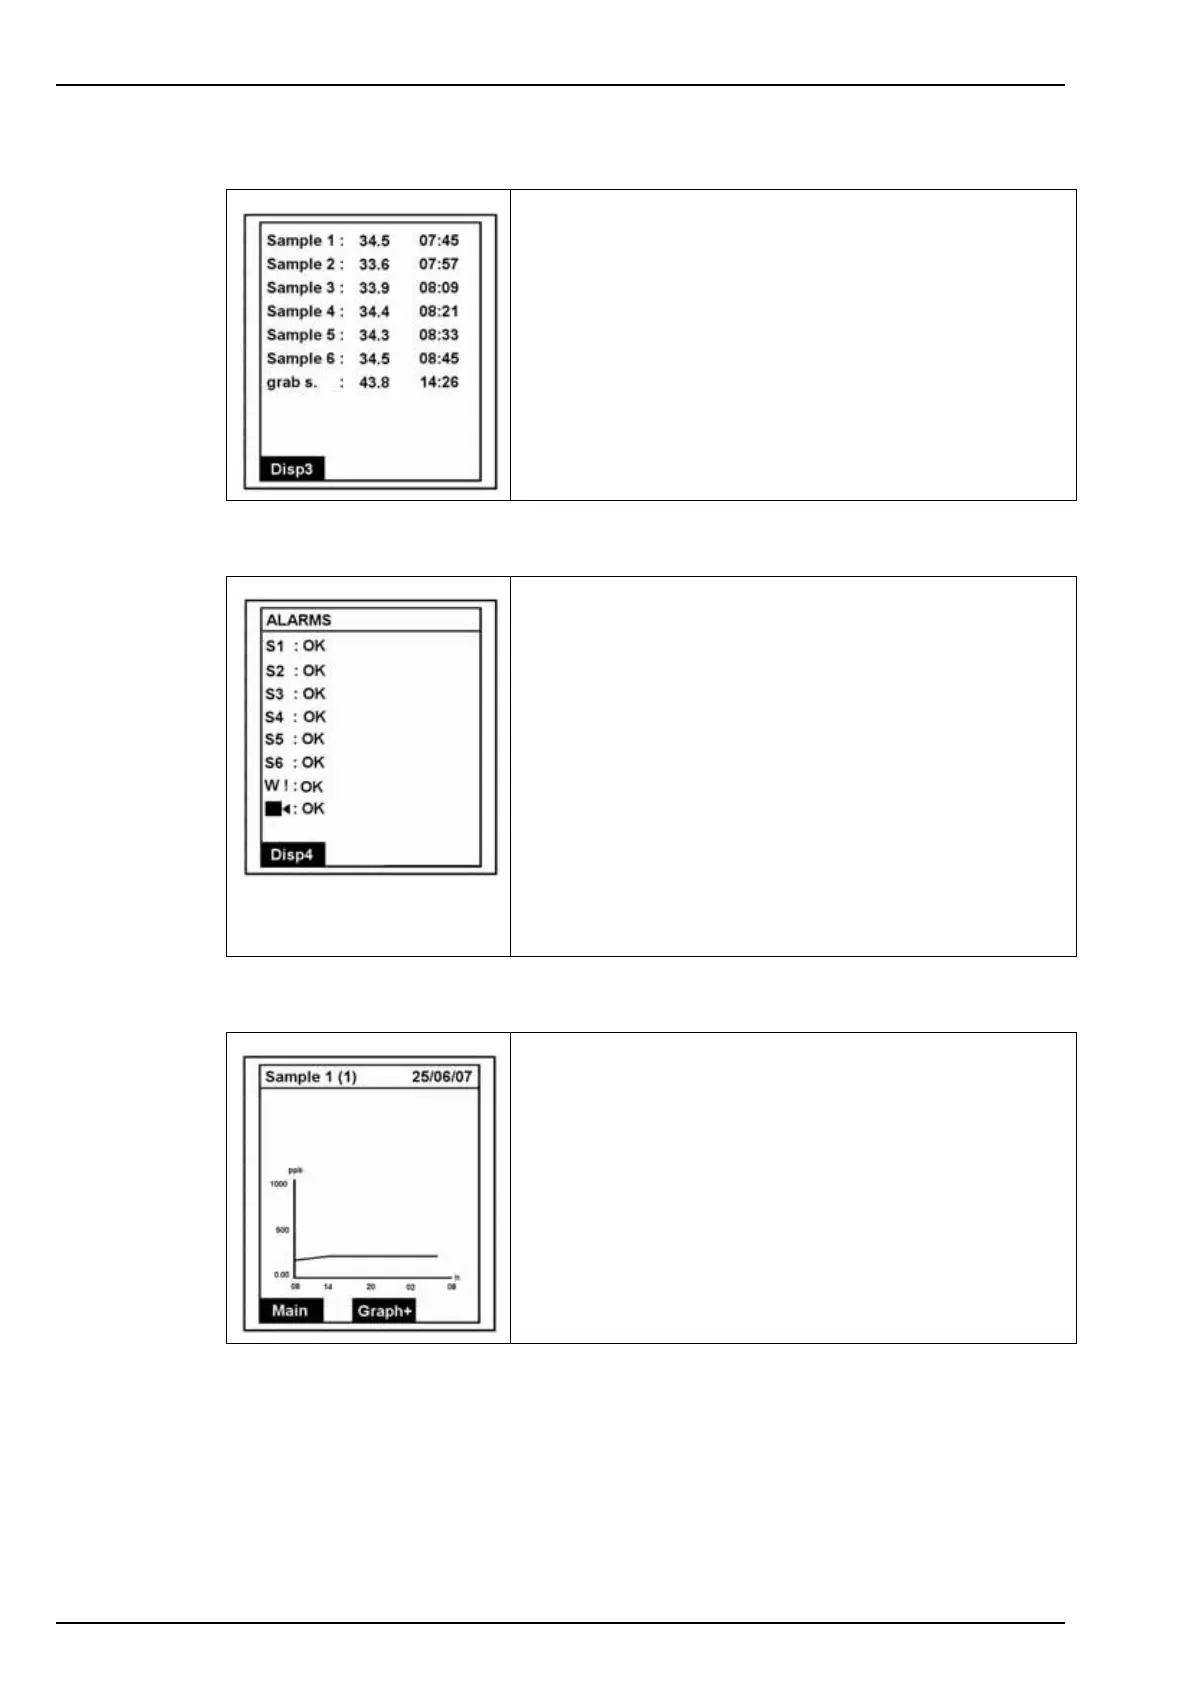
5.2.3 Display screen 3 - Alarms
5.2.4 Display screen 4 - Graph
Displays a list of the last measurements (sample name,
concentration and time the measurement was taken).
Disp3 takes you to the next display screen.
Alarms S1-S6 relate to the six alarm outputs which are
followed by the warning and system alarms.
The message against each alarm will indicate the status:
•OK to indicate no problems
• an appropriate error message
• or DISABLE to indicate the alarm has been disabled (this
only applies to the warning and system alarms)
If a manual alarm has been set, press Enter to acknowledge
and deactivate the alarm.
Refer to Alarm conditions on page 46 for a list of possible
error messages.
Disp4 takes you to the next display screen.
This screen shows the measurement trend over a 24 hour
period. The concentration scale is the same as defined by the
analog output scale low and upper values (see Affect on
page 47).
The sample name and associated analog output (in brackets)
is displayed along the top.
To display the graph for the next sample, press Graph+ or
press Main to return to the main measurement screen.