Powered by Safety
®
30
Usage
01.4IB.48041
BriteSpot® Plus
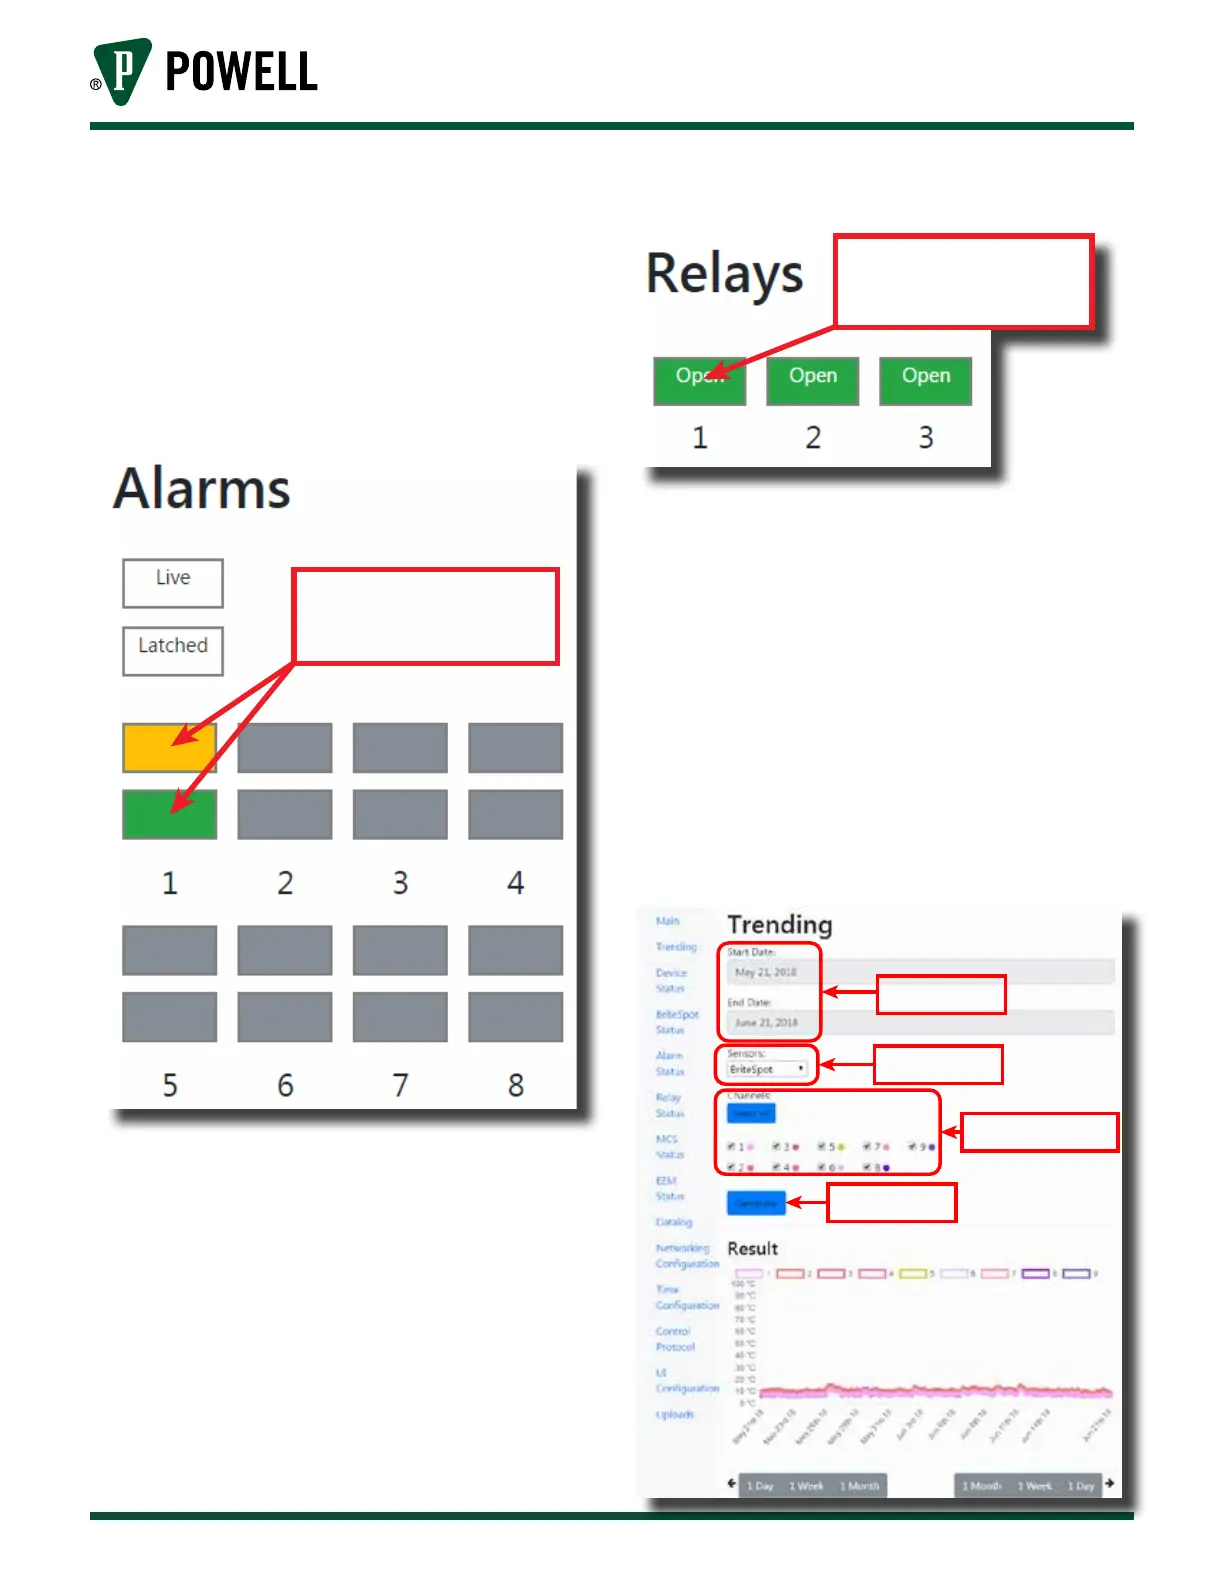
ii. The alarms area displays the present
and latched state of all the alarms.
If a given alarm is disabled its status
will be displayed gray. The alarm
status pages can be accessed by
clicking either the live or latched
status indicator (Figure 31).
Figure 31 Alarms Main Page Display
Click here to go to
alarm status page
iii. The relays area of the main page
displays the current state of the
three on board relays. The relay
configuration pages can be accessed
by clicking on the corresponding
relay status indicator (Figure 32).
Figure 32 Relays Main Page Display
Click here to go to
relay cong page
b. Sub Pages
Each of the sub page can be navigated
and a brief description of each follows:
i. The trending page allows the user to
plot stored data from the BriteSpot®
probes as well as any connected
sensors (MCS or EcoVisor™). The
user can select a date range for the
graph as well as the data sources
(Figure 33).
Figure 33 Trending Web Page
Date range input
Select sensor type
Select channels to plot
Generate graph