Chapter 9 Viewing F I L E S Viewing T H E D A T A L O G
PM130 PLUS Powermeter Series 135
Filtering and Sorting Events
You can use filtering to find and work with a subset of events that meet
the criteria you specify.
Click on the Filter button , or click on the report window with the right
mouse button and select Filter.... Check the causes of events you want to
display, and then click OK. PAS temporary hides rows you do not want
displayed.
To change the default sorting order based on the date and time, click on
the Sort button , or click on the report window with the right mouse
button and select Sort..., check the desired sort order, and then click
OK.
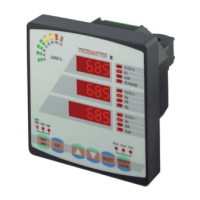
9.4 Viewing the Data Log
Data log files can be displayed in a tabular view, one data record per row,
or in a graphical view as a data trend graph.
Figure 9-2: Data Log Window
Viewing Data Trend
To view data in a graphical form, click on the Data Trend
button on
the local toolbar.
To change the time range for your graph, click on the Time Range button
on the local toolbar, and then select the desired date and time range.