Chapter 9 Viewing F I L E S Viewing T H E E V E N T L O G
134 PM130 PLUS Powermeter Series
Use the buttons on your local toolbar to zoom in and zoom
out. One click gives you a 100-percent horizontal or 50-percent vertical
zoom. Two buttons
representing magnifying glasses give you a
proportional zoom in both directions.
Copying a Graph
To copy a graph, or its part, into the Clipboard or into another application
such as Microsoft Excel or Word:
1. Click on the graph window with the right mouse button and choose
Copy All, or Copy Waveform. Some windows may have additional
options.
2. Position the cursor at the place where you whish to copy the graph.
3. Click the Paste button on the application's toolbar or select
Paste from the Edit menu.
Printing a Graph
To check how the graph appears on a printed page, select Print Preview
from the File menu.
To print a graph to a printer, click on the Print button
on the PAS
toolbar, select a printer and click OK.
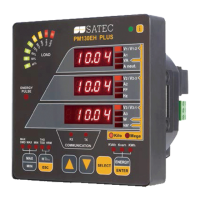
9.3 Viewing the Event Log
The Event log contains time-tagged events related to configuration
changes, resets and device diagnostics.
The Event log is displayed in a tabular view, one event per row. Use the
scroll bar to view the entire log contents.
Figure 9-1: Event Log Window
See Working with Tables for more information on viewing options.