4 BASIC CONCEPTS
4.3 Signal flow
The
PICOSCALE signals can be divided into three categories: optical signals, analog electrical
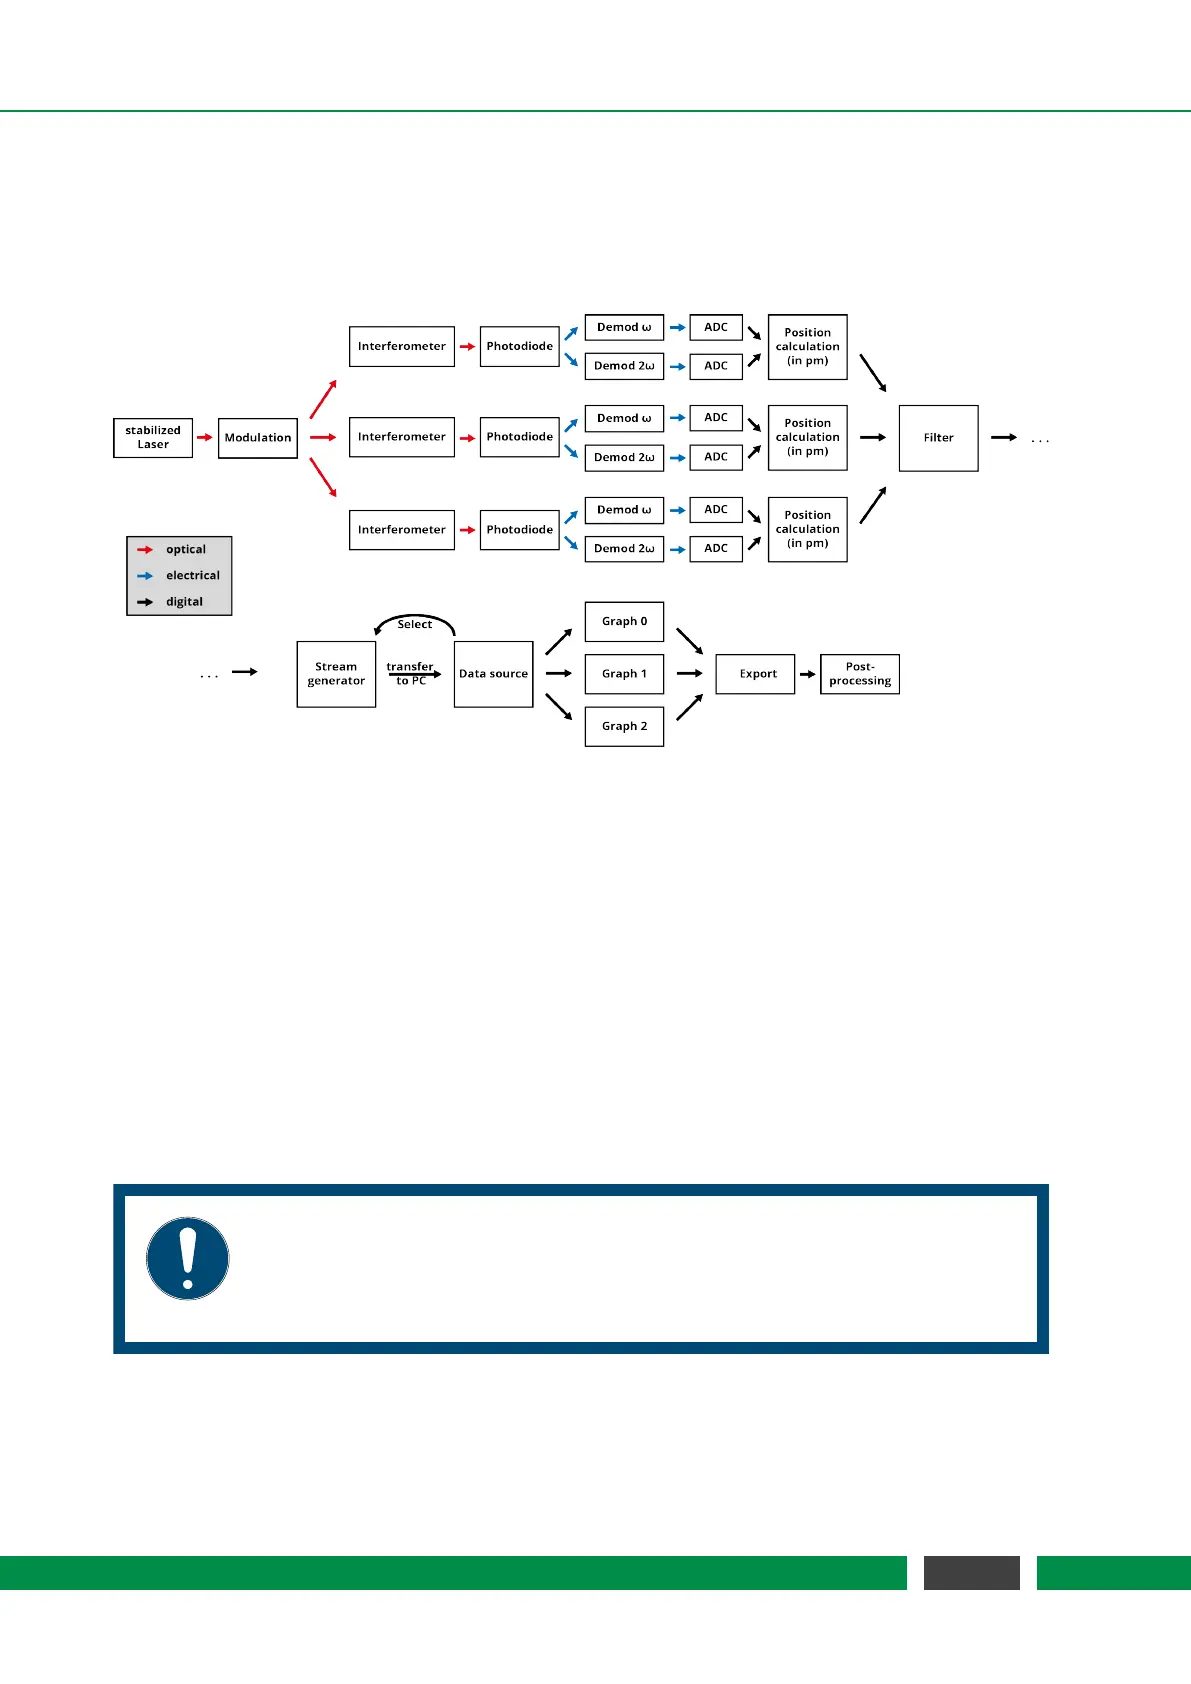
signals and digital signals. The basic and simplified signal flow is shown in figure 4.2.
Figure 4.2: Signal flow in the PICOSCALE.
At the beginning, an optical signal (light) is generated by a wavelength stabilized DFB laser diode.
The infra-red light is phase modulated with a frequency of ω =30 MHz and sent to the three sensor
heads. The interferometric signals generated in the sensor heads are detected by photo detectors
and converted into electronic signals.
The individual photo-electric signals are demodulated by both the modulation frequency and its
second harmonic (60 MHz). The resulting demodulation signals are digitized by analog-to-digital
converters (ADCs).
The digital signals are used to perform the position calculation. After appropriate filtering, the data
stream is configured and the data are transferred to the user PC. You can select the desired data
sources and display them in graphs. Finally, the data can be exported to csv-files to be available
for data post-processing.
NOTICE
The position values, generated in the FPGA, have a resolution of 1 pm. Thus, all
internal modules, especially the Advanced Trigger System and the Calculation
System, process integer numbers with the unit picometer.
25
PicoScale User Manual