7 PICOSCALE CONTROL GUI
new panel. The more tiles you select, the smaller the individual plots will be as the pattern will be
scaled to the window. You may also want to name the new panel appropriately.
7.6.2 Setting up a data receiver
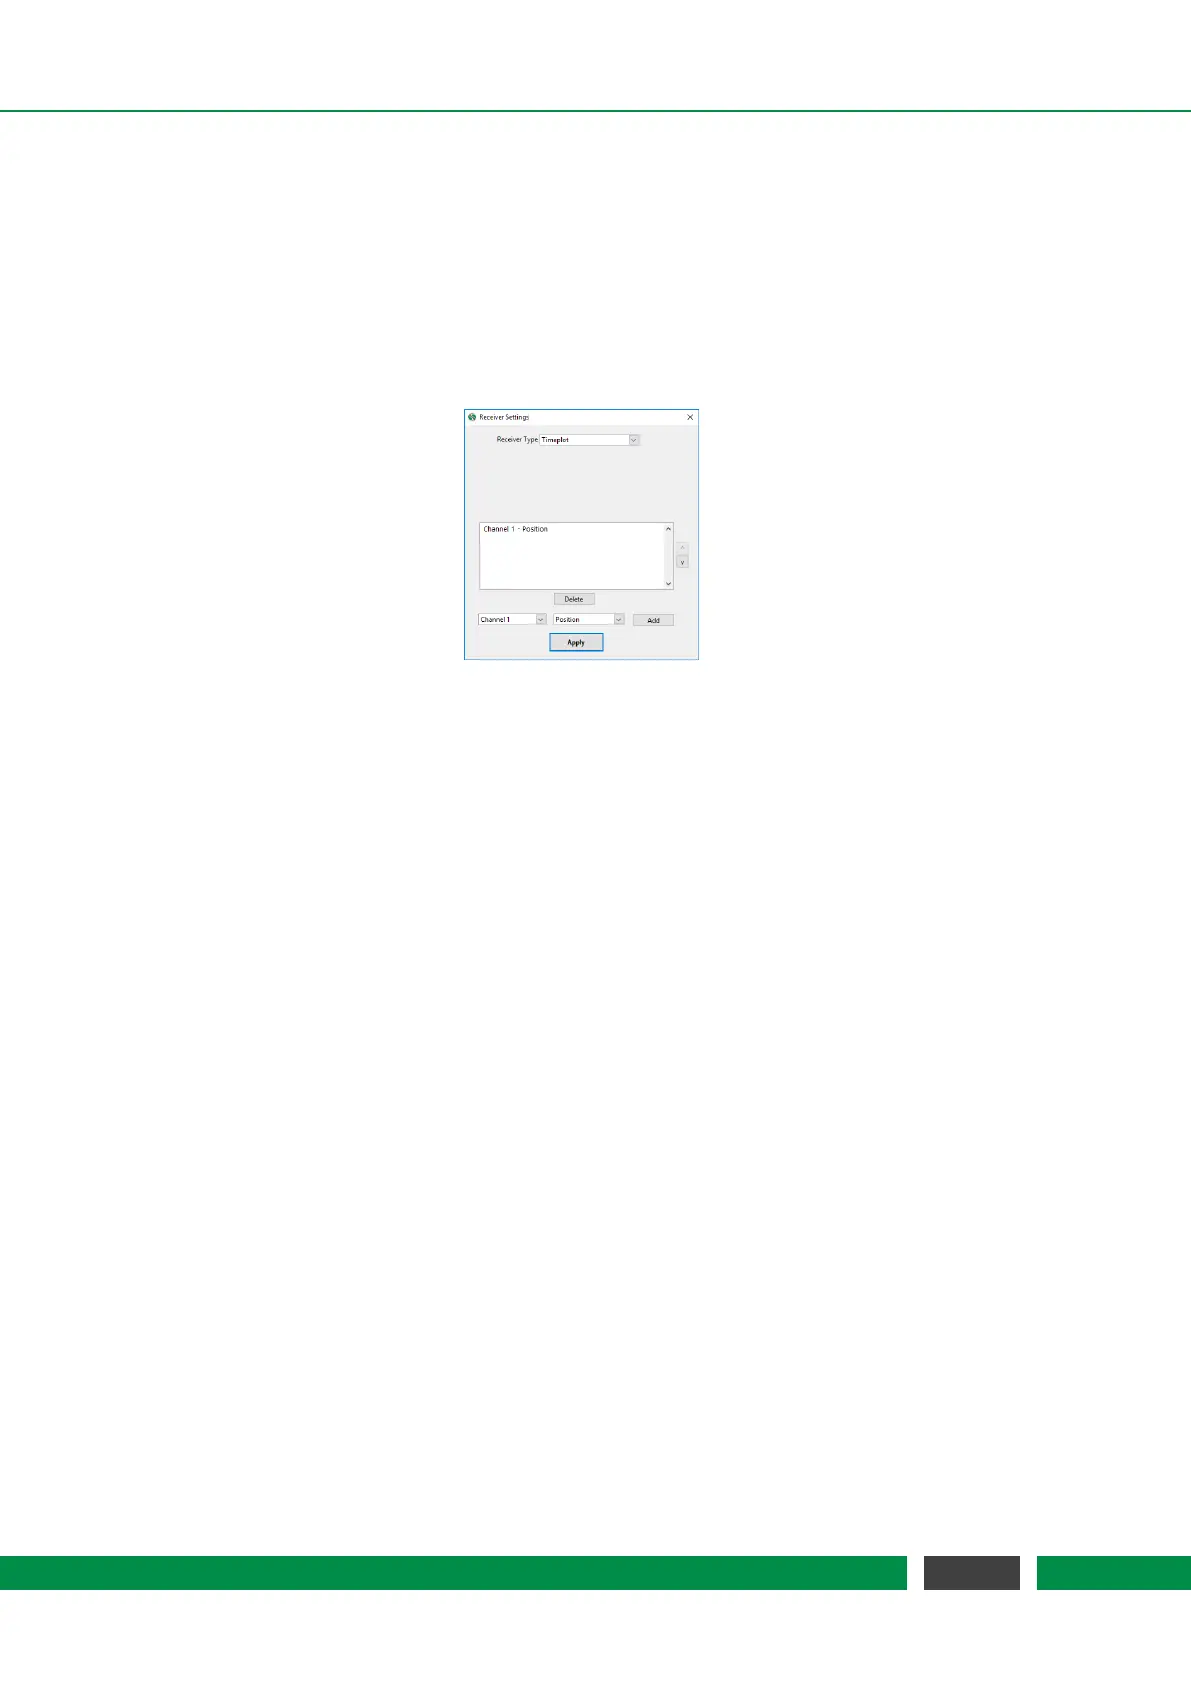
Each empty plot panel contains a Configure button that opens a Receiver Settings window shown in
figure 7.22.
Figure 7.22: Plot configuration.
The drop-down menu Receiver Type allows to select the different data streams that can be pro-
cessed and displayed. There are several types of data output possible:
• Timeplot A single plot window is shown plotting the data source(s) on the y axis over time
on the x axis.
• Timeplot (Stacked) Several timeplots (one per data source) are stacked over each other.
• XY Graph The XY graph requires two inputs. The first stream is used for the x axis and the
second stream for the y axis. A Lissajous figure can be plotted using the data sources Sw
and S2w.
• Numeric A numeric output of the data stream.
• FFT (Power Spectrum) The power spectrum (PS) of one data source is calculated. You may
change to linear scaling (taking the square-root) of the power spectrum to display the am-
plitude spectrum (AS). Changing between PS and AS can be done be right-clicking into the
plot and selecting the appropriate scaling in the Spectrum Scaling selector. Units: If you, for
example, calculate the PS of a position data source, the unit will be m
2
. If you calculate the
AS of a position data source, the unit will be m.
• FFT (Power Spectral Density) The power spectral density (PSD) of one data source is cal-
culated, which is the power spectrum scaled by the noise equivalent bandwidth. The user
may change to linear scaling (taking the square-root) of the power spectral to display the
amplitude spectral density (ASD). Changing between PS and AS can be done be right-clicking
into the plot and selecting the appropriate scaling in the Spectrum Scaling selector. Units: If
you, for example, calculate the PSD of a position data source, the unit will be m
2
/Hz. If you
calculate the ASD of a position data source, the unit will be m/sqrtHz.
72
PicoScale User Manual