7 PICOSCALE CONTROL GUI
The PICOSCALE can be controlled with the LabVIEW based graphical user interface (GUI). It con-
tains all main functions to connect to a
PICOSCALE system, to adjust it, read the device’s status,
configure all installed modules and, of course, read and process the data source values generated
by the device.
In this chapter the GUI features are presented. First, it is shown how to connect to the device
via different interfaces (USB and Ethernet) and read its status. Furthermore, the GUI exhibits an
adjustment panel, which guarantees a quick and easy adjustment of the PICOSCALE system with
user friendly auto-functions. Position data as well as other data sources can be displayed in the
the Stream Monitor.
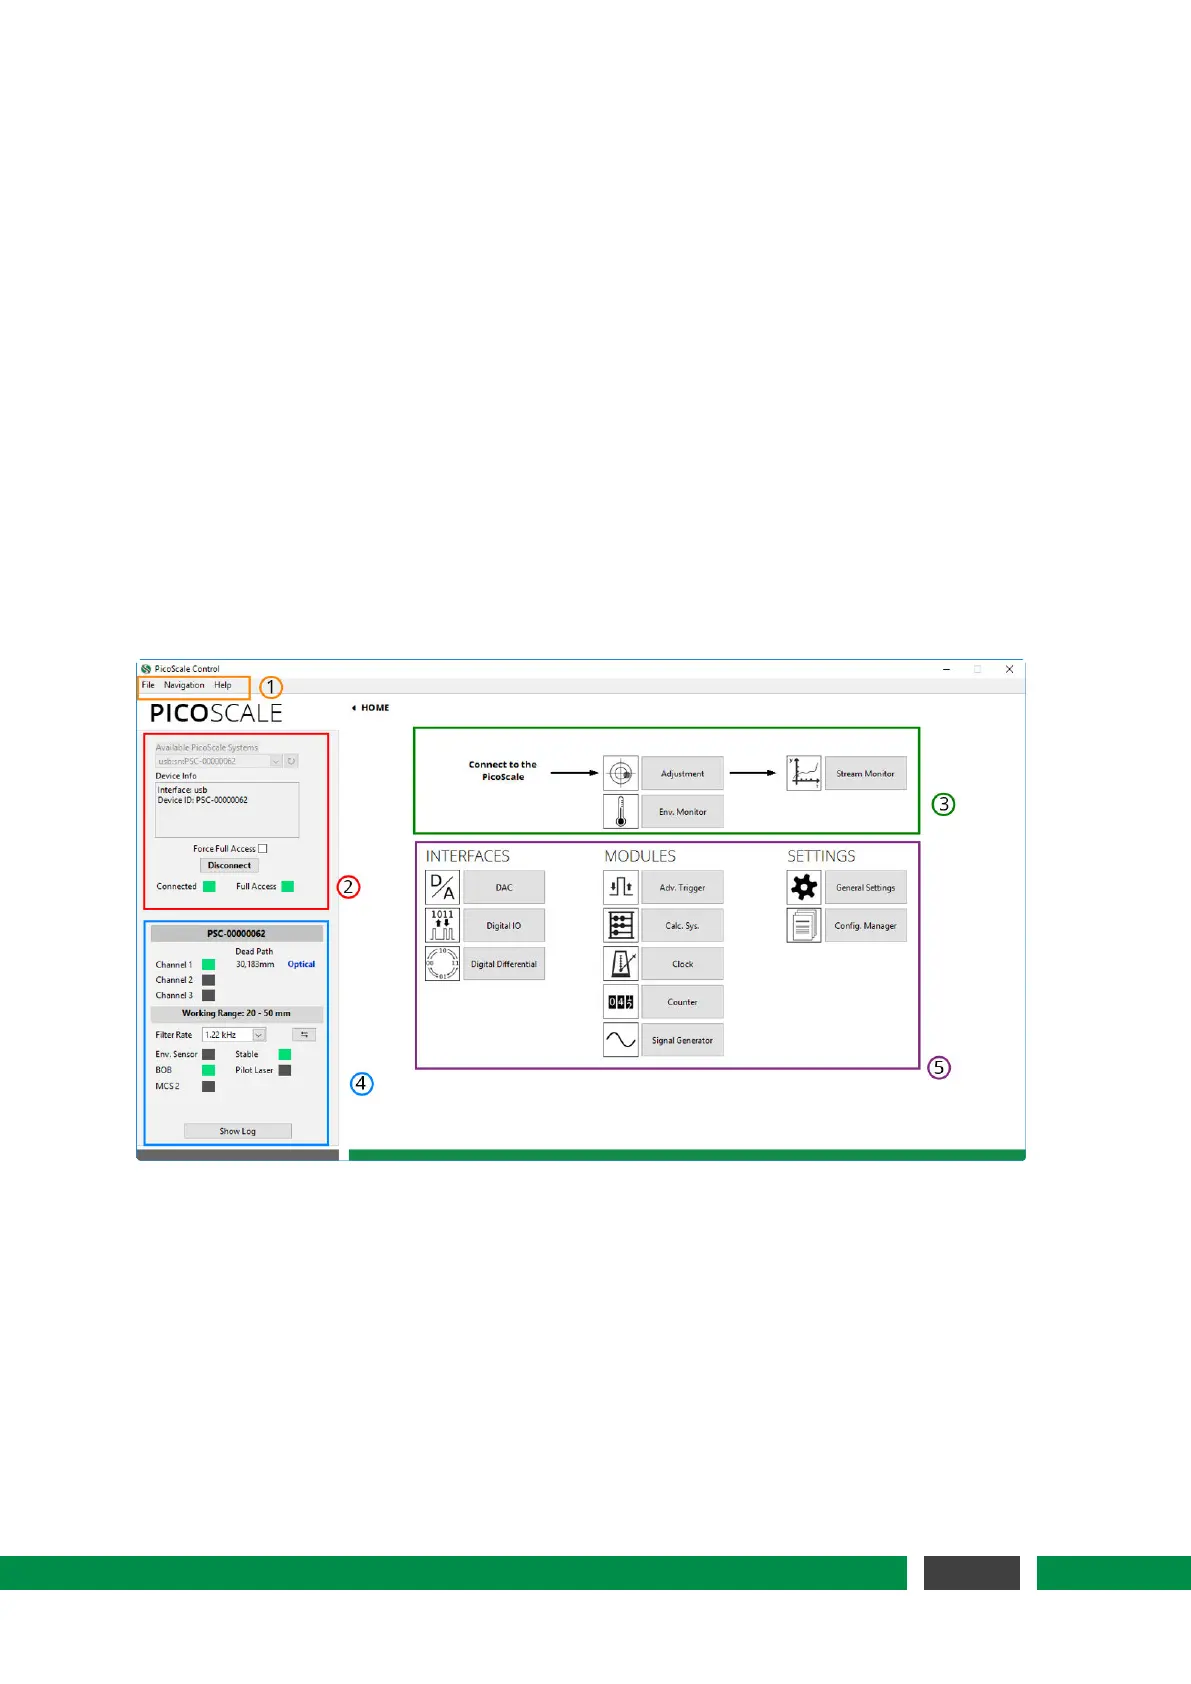
Figure 7.1: PICOSCALE GUI overview. (1) Menu (2) Connect to PICOSCALE (3) Adjustment, Envi-
ronmental Monitor and Stream Monitor (4)
PICOSCALE Status (5) Interfaces, Modules
and Settings.
After the program is started you can see the HOME panel as shown in figure 7.1. All parts of
the GUI can be reached from the HOME panel either by clicking on the corresponding buttons or
with the menu (1). All available
PICOSCALEs are listed in (2). After connecting to the system the
adjustment and data streaming (3) as well as the
PICOSCALE status (4) are available. All interfaces,
modules and the general settings can be centrally reached (5).
49
PicoScale User Manual