3-13
Case Profile Configuration
Multi-Graphs (Optional)Multi-Graphs (Optional)
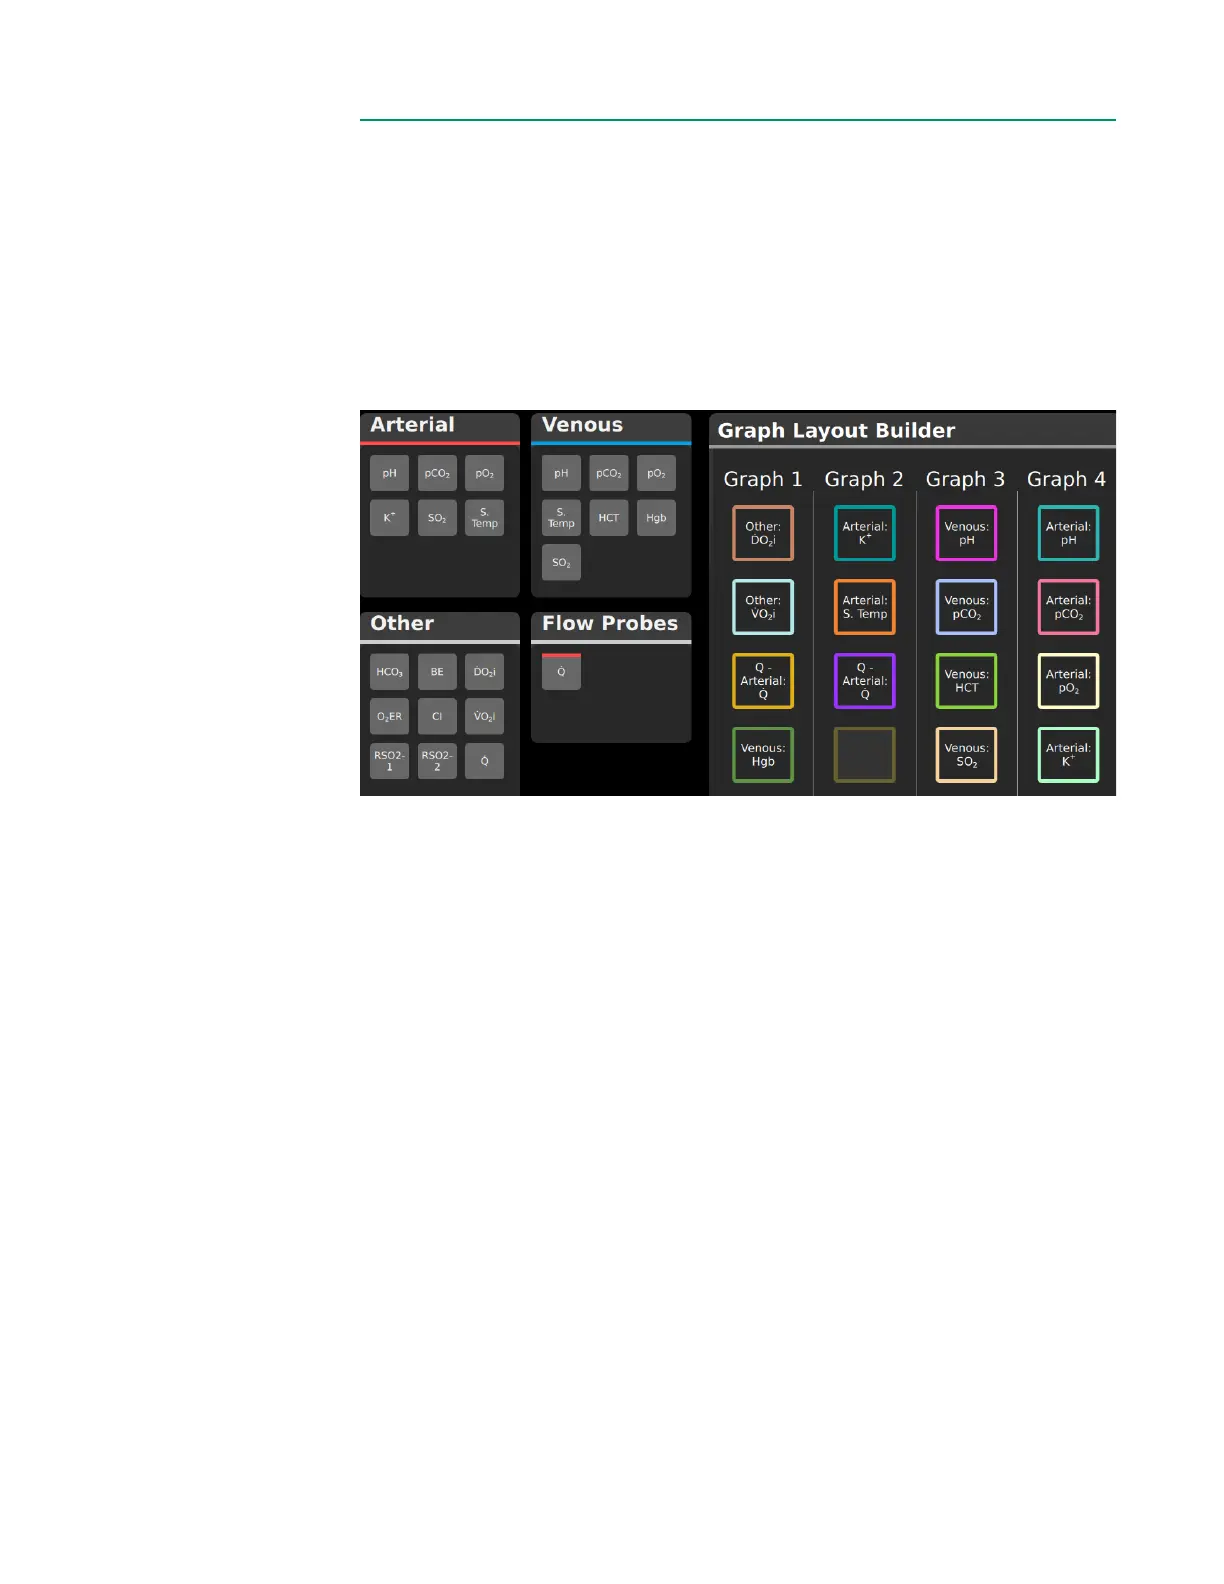
The CDI OneView System can display the patient’s blood gas parameter values
in graphical format. The purpose of Graph Layout Builder is to create optional,
multi-parameter graphs. Up to four such multi-graphs can be congured to view
simultaneously. Any parameter that has been congured on the Display Layout tab
can be added to a graph, and each graph can include up to four parameters.
Note: Any parameter can be viewed as a single graph by tapping on that
parameter tile on the Measurement Screen.
To create and edit multi-graphs:
1. To add a parameter to a graph, tap on the parameter tile. Once the parameter
tile is selected, available cells are highlighted in the Graph Layout Builder. Tap
one of the available cells to place the tile. The parameter is placed in the cell,
and the parameter’s outline color in the Graph Layout Builder reects the color
of its graph line when viewed in Measurement Mode.
2. To remove a parameter from a graph, tap on the parameter in the Graph
Layout Builder.
3. Tap Save when all graphs are congured as desired.
Note: Any tile under any graph can be left empty.
Note: The same parameter can be added to multiple graphs.
Note: A single parameter cannot be added twice to the same graph.