RADIATION STATISTICS
Radioactive emission is a random process. The number of emissions in a
given time period is not constant but varies statistically about an average
value. The variation in the number of emissions follows a Poisson
distribution about the true mean value. In this distribution, the standard
deviation (
σ
) about the mean (n) is defined as:
σ
=
√
n.
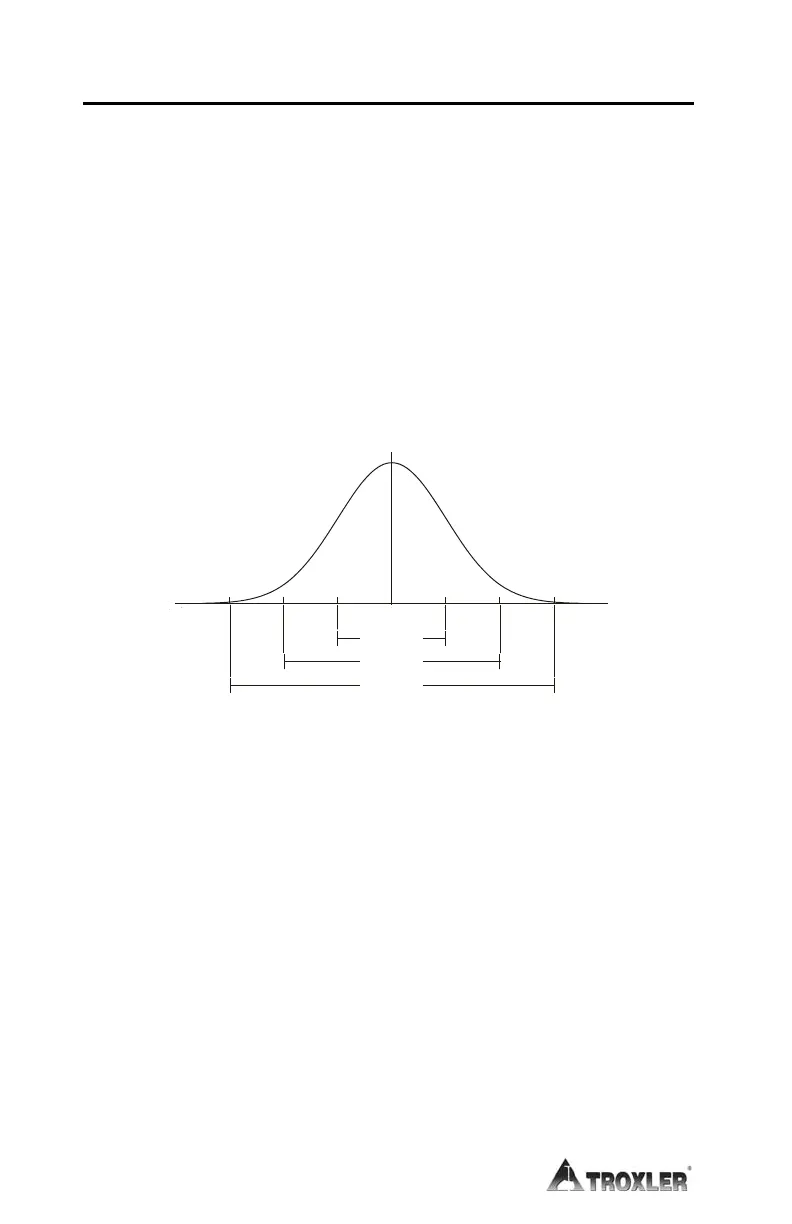
When the mean is greater than 100, the Poisson distribution can be closely
approximated by the normal distribution (Figure B–2). The normal
distribution predicts the probability that any given count rate will fall
within a selected region about the mean.
Normal Distribution
MEAN
68.3%
95.4%
99.7%
-3
σ
-2
σ
-1
σ
3
σ
2
σ
1
σ
Figure B–2. Variation of Radioactive Emission
Using the mean of a larger number of counts to approximate the true mean,
the distribution shows that 68.3% of the time the count rate obtained will
be within ±1 standard deviation of the mean. Figure B–2 shows the
probabilities of counts falling within three standard deviations of the mean.
The operator can perform a statistical stability test (stat test) to compare the
experimental standard deviation to the theoretical standard deviation (see
page 6–3).
B–4

 Loading...