19.0 Results
Measurements are accessed by tapping the Results icon in the main menu. The results comprise a range of tabbed pages,
similar to the setup pages.
Summary
PDH Errors / Alarms
Event Log
Signal
Analysis
Histograms
Graph
Go back to top Go back to ToC
19.1 PDH Results
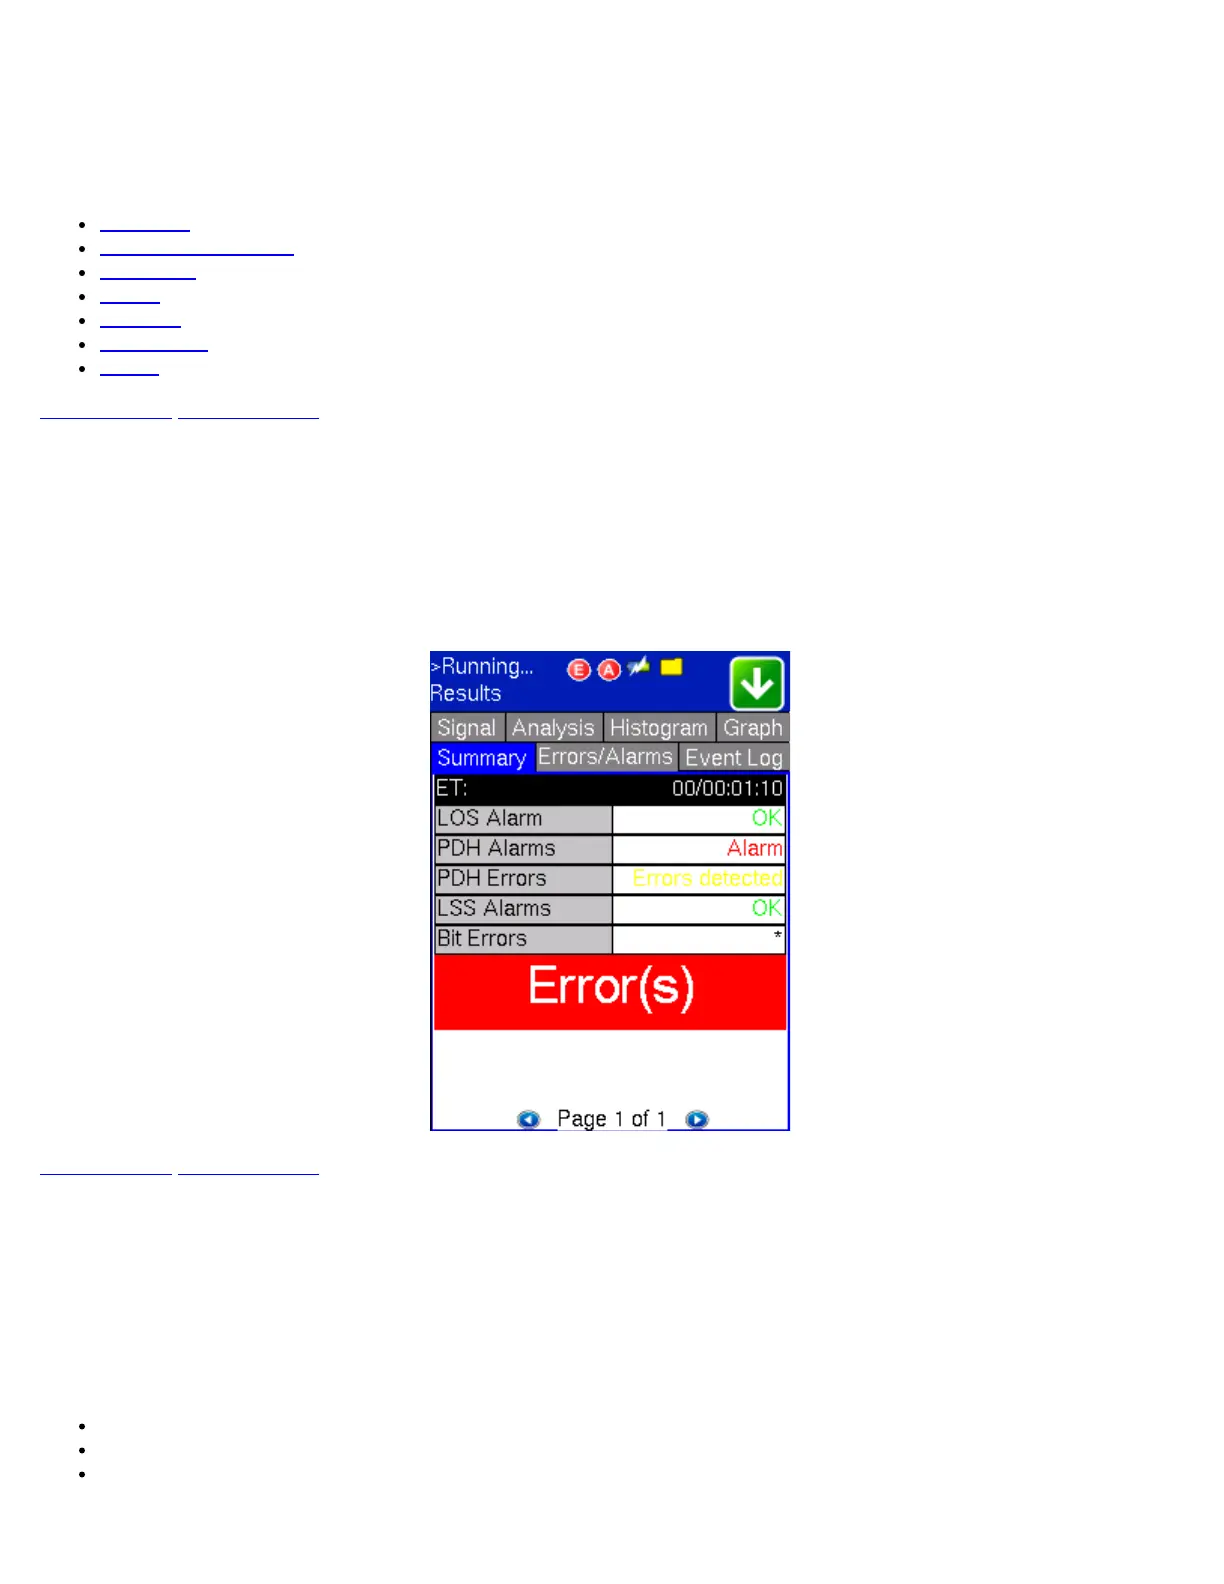
19.1.1 Summary
The Summary tab displays an overview of the major test parameters. At a glance, the user is able to see if there are any alarms,
errors or signal failure. The selected performance analysis test and its current verdict (Pass or Fail) is also displayed..
PDH Summary
Go back to top Go back to ToC
19.1.2 PDH Errors/Alarms
The Errors/Alarms tab brings up several pages showing the errors and alarm status. Page 1 of 4 (Dual E1 mode, Page 1 of 6)
provides an overview of all the errors and alarms applicable to the signal or network under test. The color of the page tab is
normally blue; however, it will turn red when an alarm error condition has been detected or recorded.
The soft LEDs on-screen are arranged logically and will depend on signal hierarchy, structure, payload and framing selected. The
soft LEDs have a tricolor function:
Green: No error or alarm is present
Red: An error or alarm condition is detected and is currently present
Yellow: Indicates a history condition. An error or alarm was detected during the measurement interval, but it is no longer
present or active
TX130M+_e-manual_D07-00-051P_RevD00
 Loading...