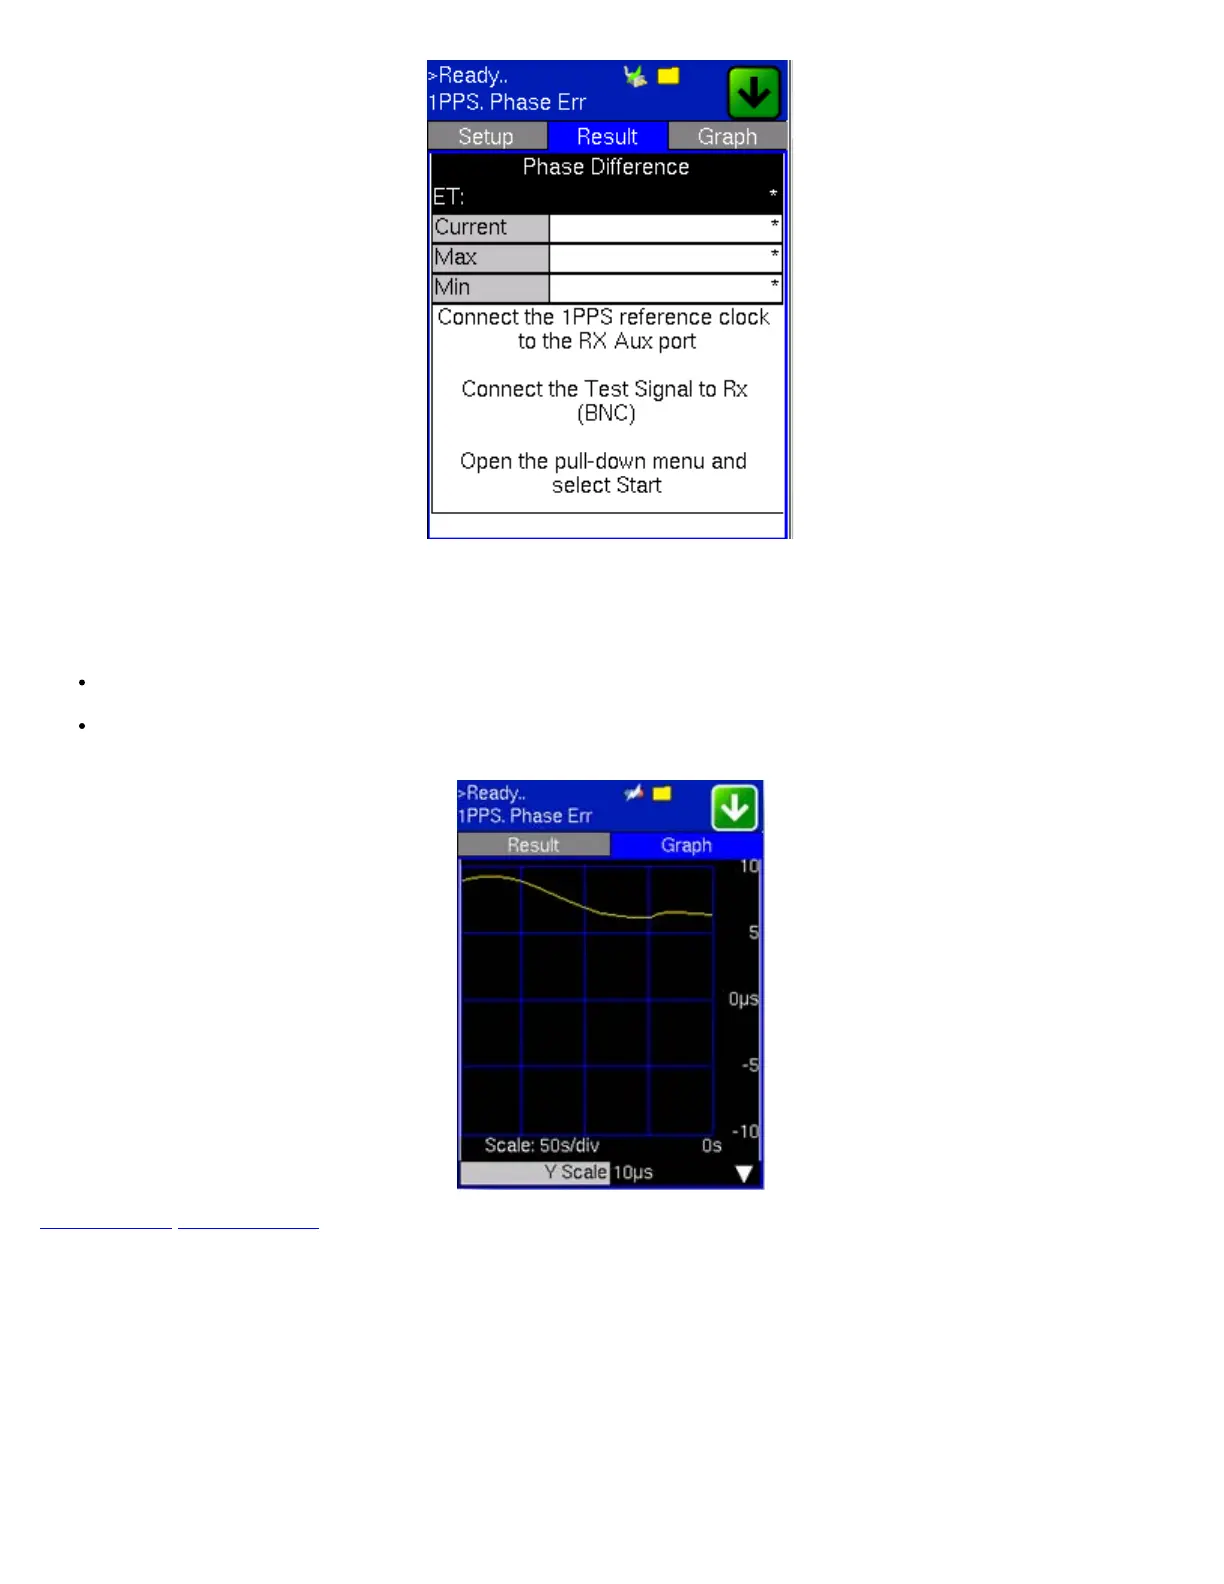
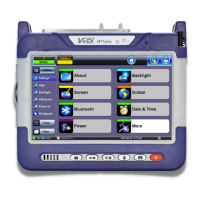
Graph
The Graph tab shows the phase variation between the 1PPS under test compared to the 1PPS reference for the last 200
seconds for a quick visual verification of accuracy and stability.
Vertical Scales: ±1µs, ±10µs, ±100µs, ±500µs
Horizontal Scale: 200s (50s/div)
1PPS Phase Analysis - Graph
Go back to top Go back to ToC
TX130M+_e-manual_D07-00-051P_RevD00