Test Result screens below.
Pressing Restart at the bottom of the screen will clear the counter and histograms.
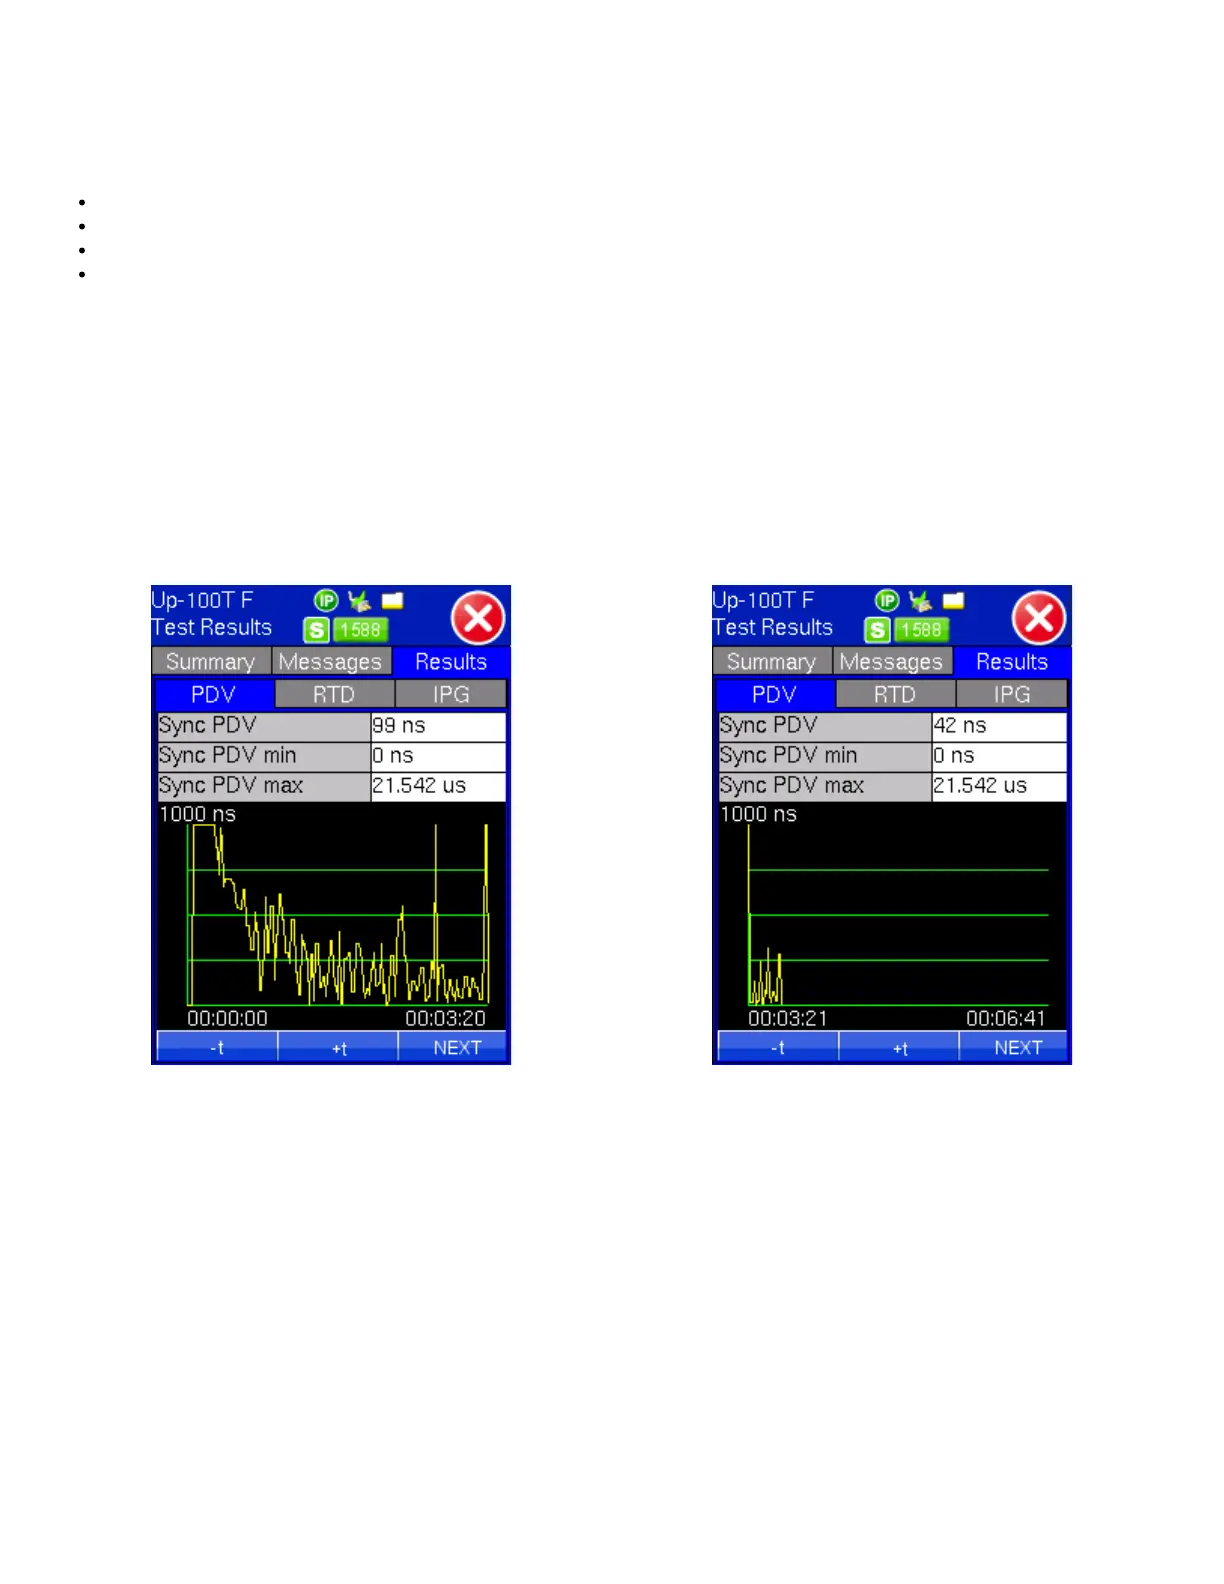
PDV: Delay Request, Asymmetry, and Sync PDV min and max information.
Delay Request: The Delay_Req PDV measures t4-t3 (delay message jitter)
Asymmetry: The Asymmetry PDV measures (t4-t3)+(t2-t1) (this measures the Delay)
Sync PDV: The Sync PDV measures t2-t1 (sync messages jitter)
RoundTrip PDV: The RoundTrip PDV measures (t4-t3)+(t2-t1), which is the Delay measurement packet delay variation
RTD: RTD and Delay Response RTD min and max information.
The RTD graph measures the time between when the delay_req leaves the slave and the delay_resp is received
by the slave.
IPG: Sync and Delay Response IPG min and max information.
The IPG graphs give information about the Sync and Delay_resp arrival rate. This will depend on the setting 16 vs
32 vs 64. It can be used as a confirmation that the rates are as expected. This can be also verified with the packet
counters.
PDV Test Results (0-3:20) PDV Test Results (3:21-6:41)
RTD Test Results IPG Test Results
TX130M+_e-manual_D07-00-051P_RevD00
 Loading...