10-45
IM 701310-01E
Analysis and Search
3
2
1
4
5
6
7
8
9
10
11
12
13
14
15
16
17
18
19
App
Index
10.8 Displaying a Histogram, Trend, or List of the
Automatically Measured Waveform Parameters
Procedure
1.
Carry out steps 1 to 4 in section 10.5 to set the analysis type to Wave Parameter.
Selecting the Display Mode
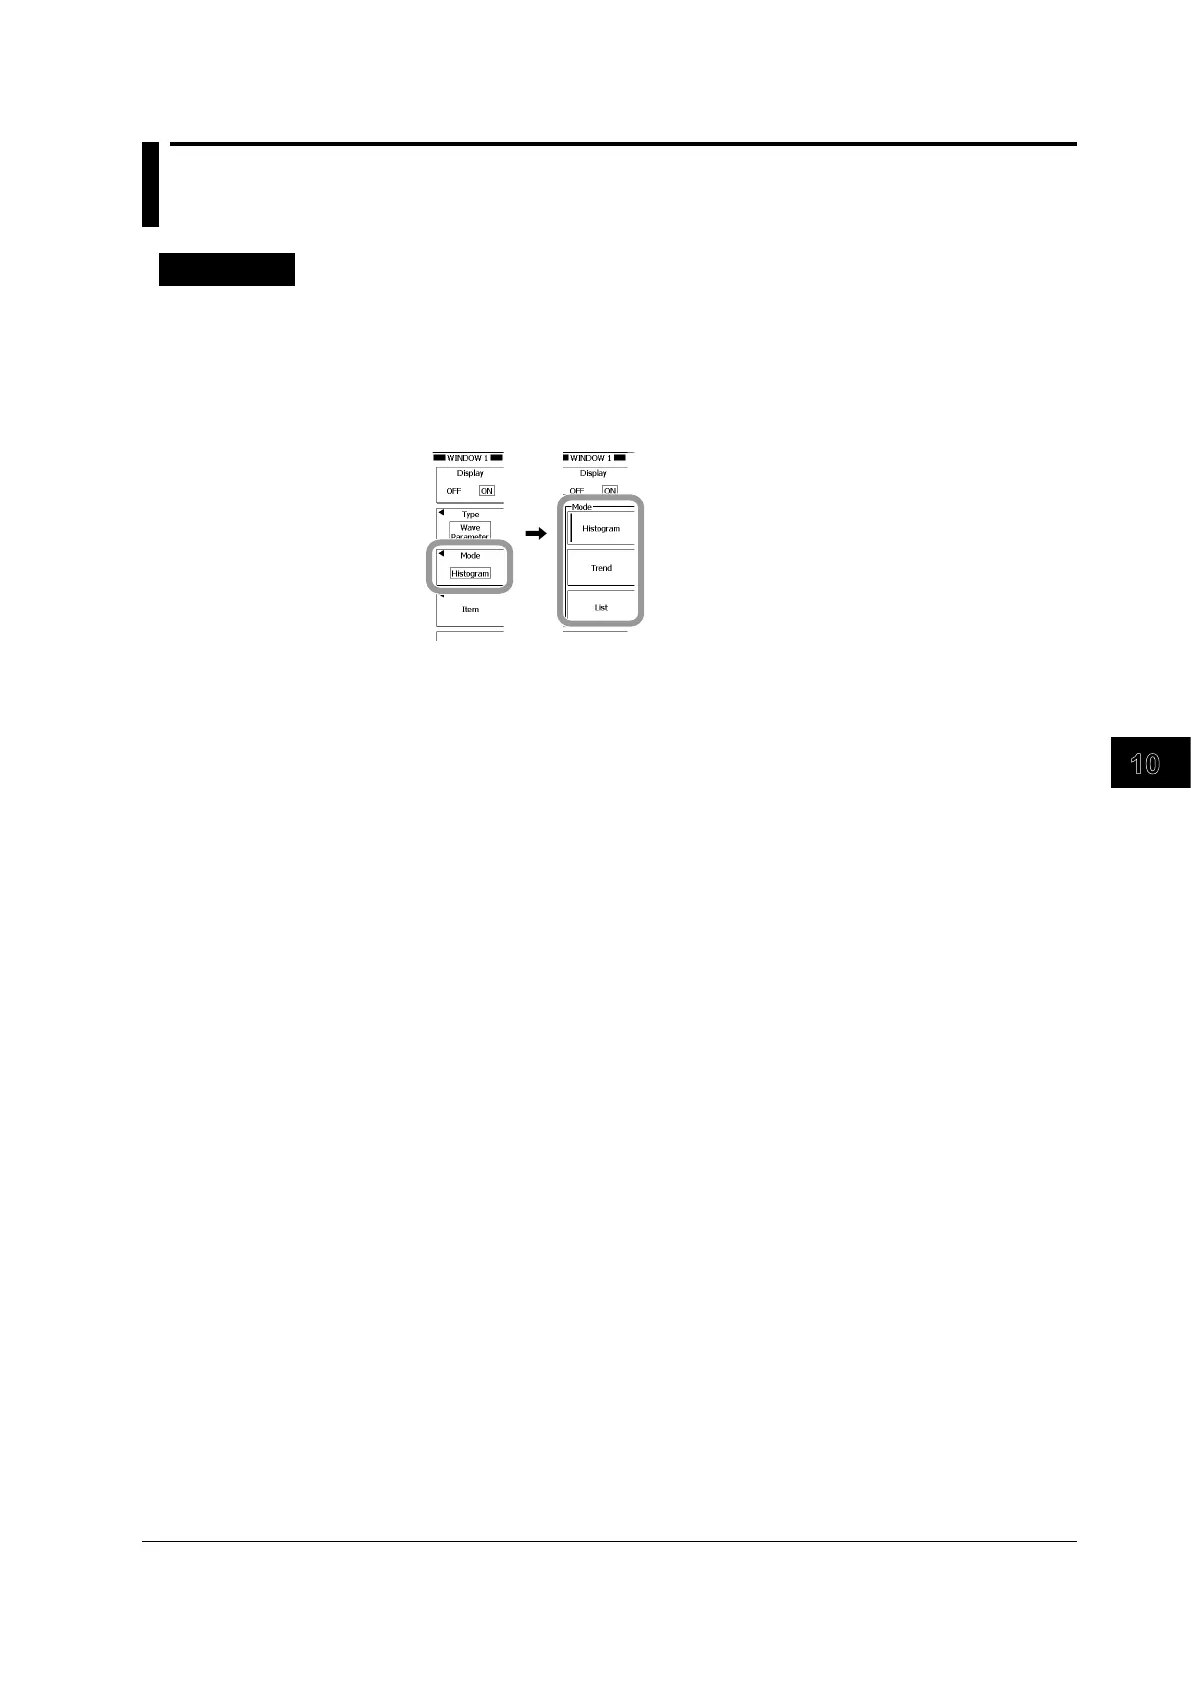
2.
Press the Mode soft key.
3.
Press a soft key from Histogram to List to select the display mode.
Proceed to the steps on the pages indicated below according to the selected dislay
mode.
• Histogram: Step 4 on page 10-46
• T
rend: Step 4 on page 10-49
• List: Step 4 on page 10-50
 Loading...