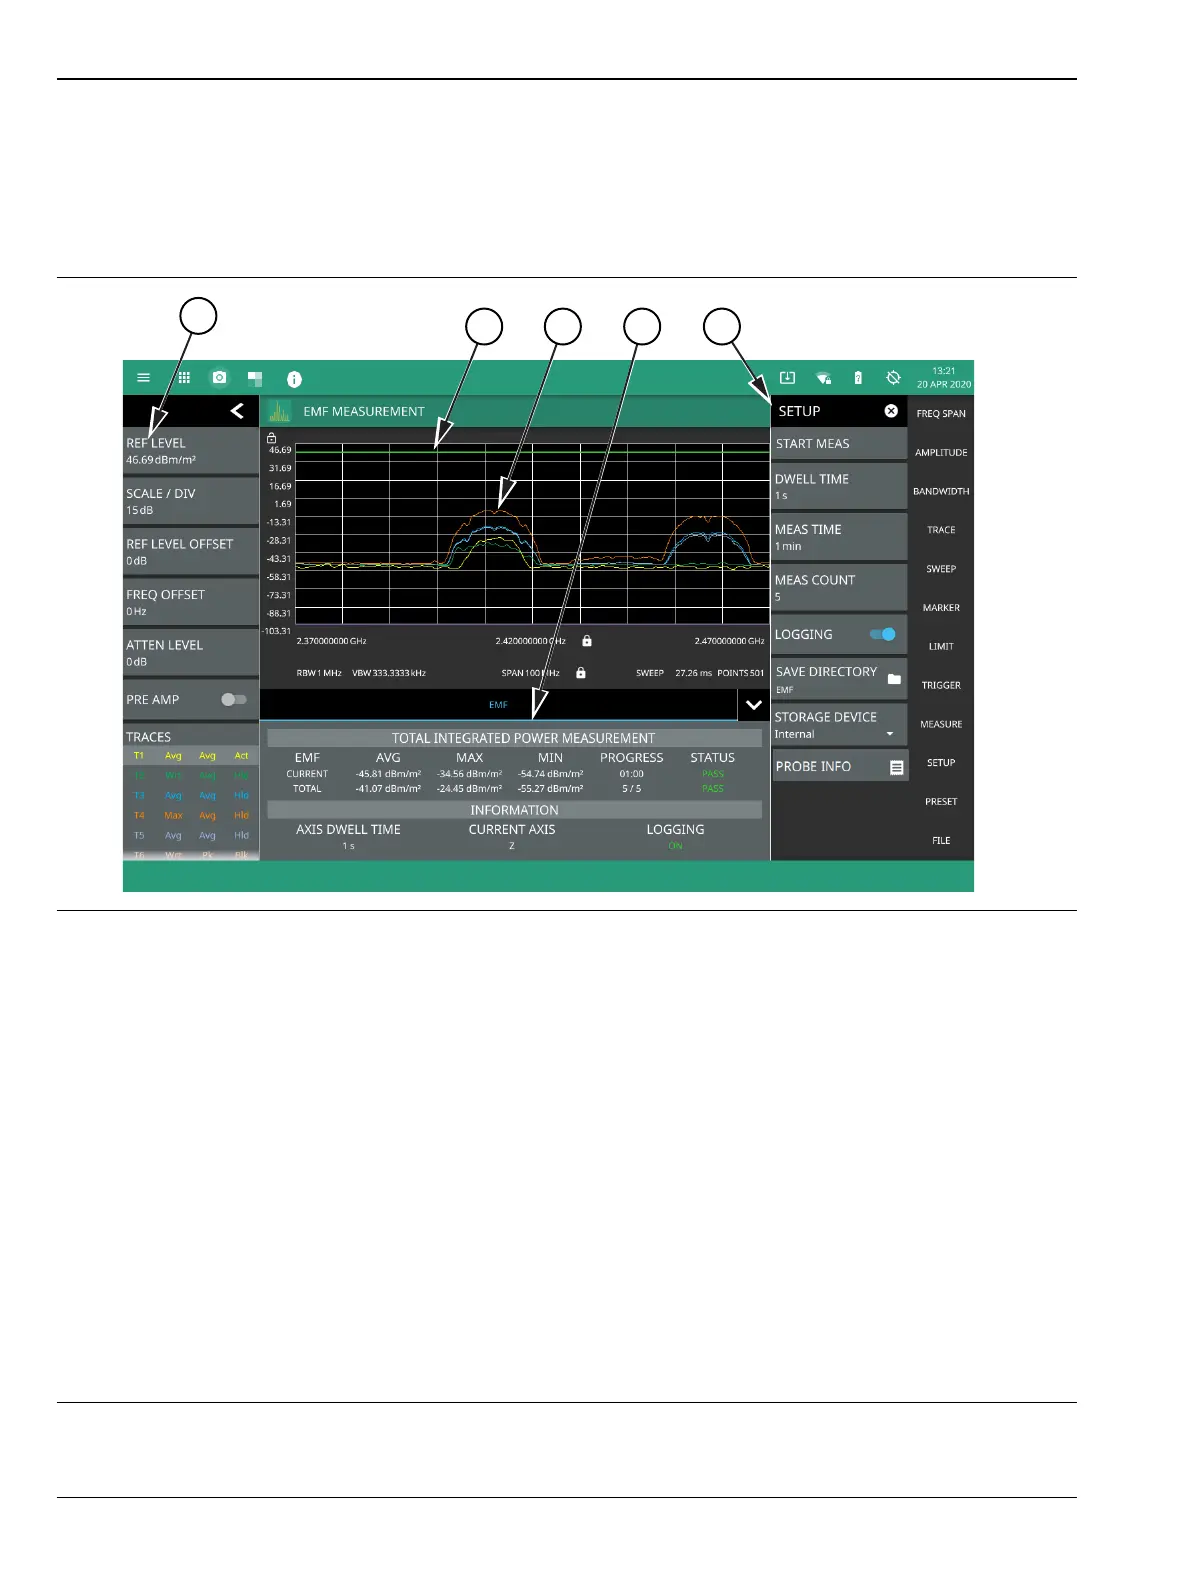
3-18 Electromagnetic Field (EMF) Measurements (Option 444) Spectrum Analyzer Measurements
3-88 PN: 10580-00447 Rev. H Spectrum Analyzer MG
After completing the data collection for the three axes (X, Y, and Z), the isotropic result is calculated and
displayed. In addition to the traces displayed on the user interface (axis sweep data, current isotropic result,
and average and max isotropic result), the max, min, and average of the total integrated power of the isotropic
result over time is computed and displayed in the table below the graph region. The CURRENT values are
calculated over the elapsed measurement time and the TOTAL values are calculated over the entire
measurement time and total number of measurements.
1. The status panel provides quick access to common spectrum analyzer settings. See “STATUS PANEL (EMF
Measurement)” on page 3-89.
2. EMF measurement pass/fail status uses a limit line for the test criteria. You can use either a custom limit line or
toggle the International Commission on Non-Ionizing Radiation Protection limit. Either limit supports the same
features as in the spectrum analyzer mode. See “LIMIT Menu” on page 3-53.
3. The trace display area shows traces for the following measurements in units/m
2
:
• Trace 1: Current axis sweep data
• Trace 2: Current isotropic result
• Trace 3: Average isotropic result
• Trace 4: Maximum isotropic result
• Trace 5: Total average isotropic result
Note that trace detectors and trace averaging are disabled for the EMF measurement.
4. Tabular measurement data shows the current and total EMF measurement results, the current test progress,
and the pass/fail status. The information area shows the axis dwell time, the current axis being measured, and
the data logging state.
5. Use the SETUP menu to configure the EMF measurement settings. See “SETUP Menu (EMF Measurement)”
on page 3-90.
Figure 3-72. EMF Measurement
 Loading...