3-7 Setting Trace Parameters Spectrum Analyzer Measurements
3-26 PN: 10580-00447 Rev. H Spectrum Analyzer MG
Trace Detector Types
The figure below illustrates how the available detector types determine a trace data point from the sampled
data.
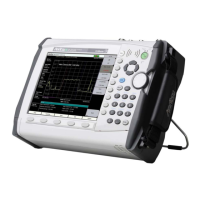
Peak
Shows the maximum amplitude of sampled data for each display point, assuring that a narrow peak is not
missed.
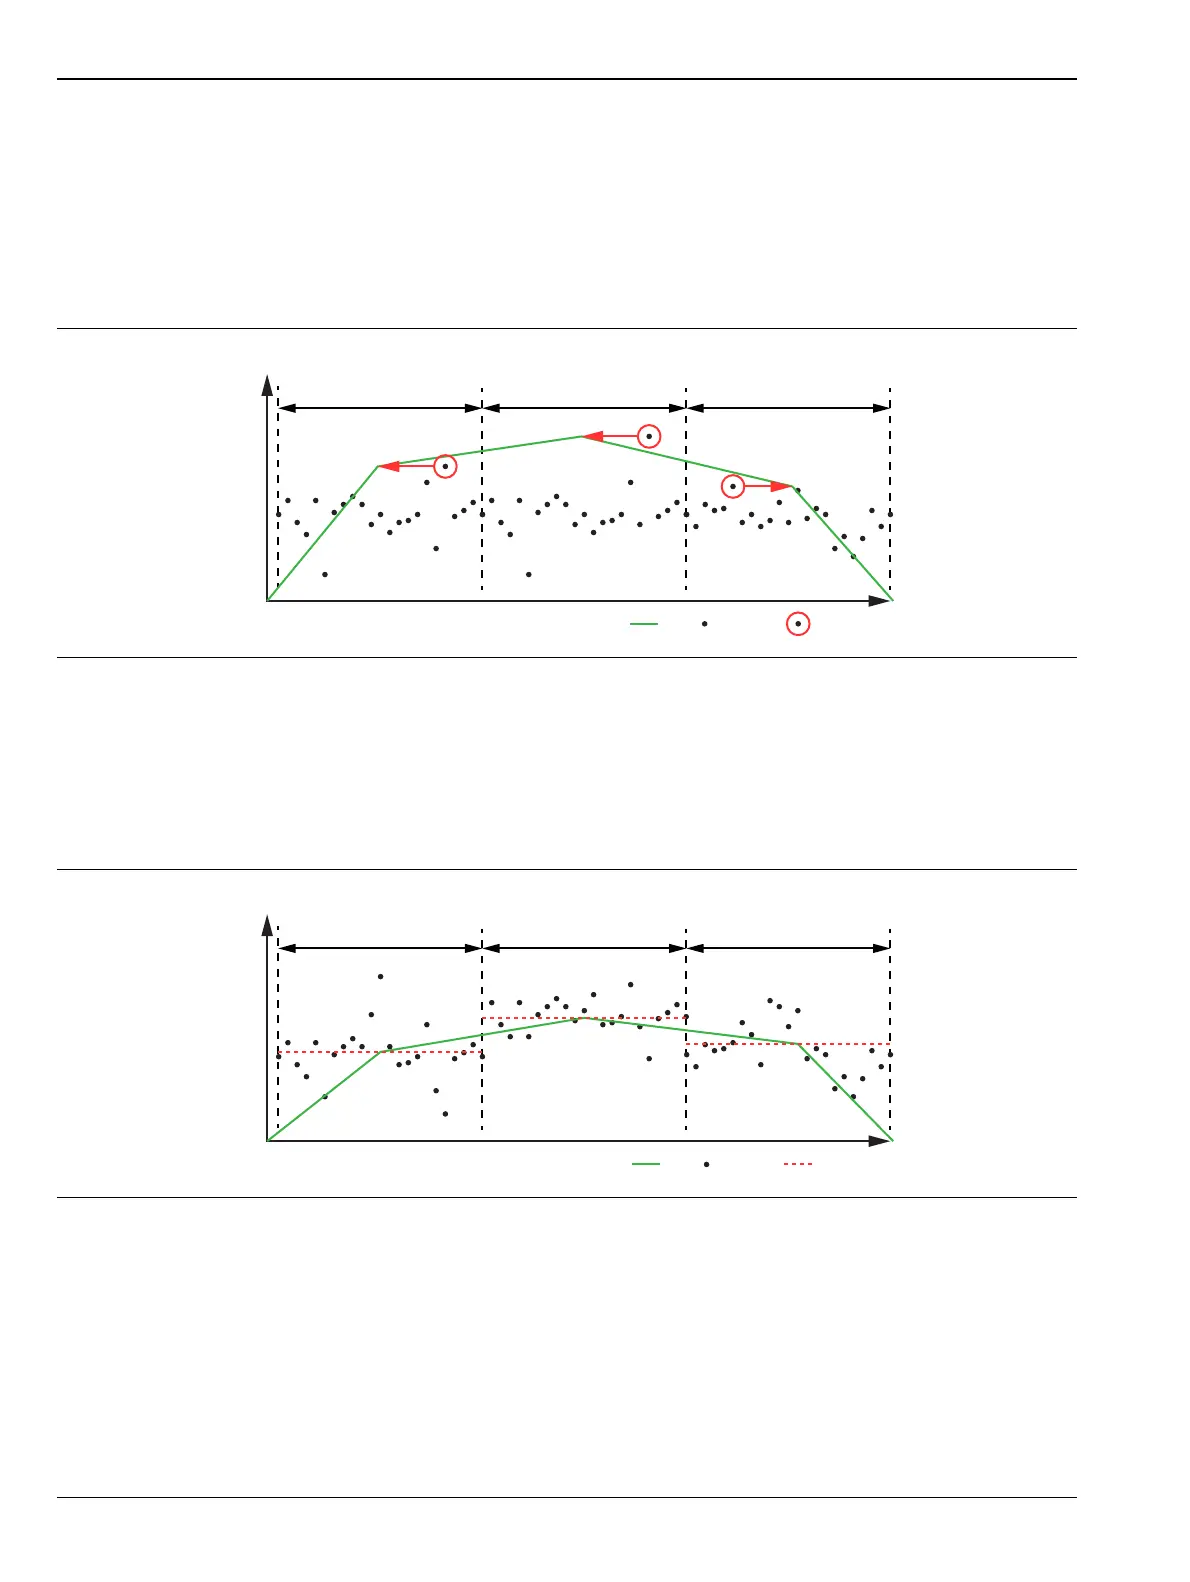
RMS/Avg
In the default case, when the VBW/AVERAGE type is set to Linear, this method shows the linear average
amplitude of sampled data for each display point, before converting to display units. When VBW/AVERAGE
type is set to Log, this method shows the traditional average of log (power), such as dBm for each display point,
before converting to display units. Not available in zero span.
Figure 3-16. Peak Detector Type
Figure 3-17. RMS/Avg Detector Type
Peak Detection
Odd Display Point Sampling Interval
Amplitude
Even Display Point Sampling Interval Odd Display Point Sampling Interval
Frequency/Time
Selected Data PointData PointTrace
Frequency/Time
RMS/Avg Detection
Odd Display Point Sampling Interval
Amplitude
Even Display Point Sampling Interval Odd Display Point Sampling Interval
Average Data PointData PointTrace