3-20 AM/FM Audio (Requires Option 24 or Option 509) Spectrum Analyzer Measurements
3-104 PN: 10580-00447 Rev. H Spectrum Analyzer MG
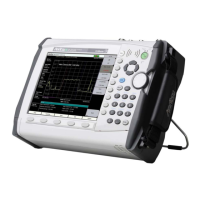
AM/FM Audio – RF Spectrum View
The RF spectrum view displays the carrier signal power of the demodulated AM/FM audio signal in frequency
domain.Toggle DEMOD MARKER button to identify the peak value of the carrier power. You can also record
the audio signal by setting the duration time. Make sure to toggle on the Audio button to listen to the signal by
adjusting the volume accordingly.
1. The status panel provides quick access to common spectrum analyzer settings. See “STATUS PANEL (AM/FM
Audio)” on page 3-111.
2. The trace display area can show multiple traces, each with a unique color. Each trace can be set to Clear/Write,
Average, Min or Max Hold, Rolling Average or Rolling Min, or Max Hold. Each trace can have Peak,
RMS/Average, or Negative detectors. Traces can be set to Active, Hold/View, or Blank. Refer to “Setting Trace
Parameters” on page 3-21. The shaded vertical section marked with green dashed line illustrate the
demodulation channel bandwidth.
3. The demodulation marker is the same as a regular marker and can be applied to any trace using the Marker
Menu. Refer to “Setting Up Markers” on page 3-44.
4. Current frequency, bandwidth, and sweep settings. Refer to “Setting Frequency Parameters” on page 3-2,
“Setting Amplitude Parameters” on page 3-8, “Field Strength” on page 3-14.
5. The SETUP menu is where the AM/FM demodulation settings are configured. See “SETUP Menu (AM/FM
Audio RF Spectrum)” on page 3-105.
Figure 3-85. AM/FM Audio (RF Spectrum)
 Loading...