3-9 Setting Up Markers Spectrum Analyzer Measurements
3-50 PN: 10580-00447 Rev. H Spectrum Analyzer MG
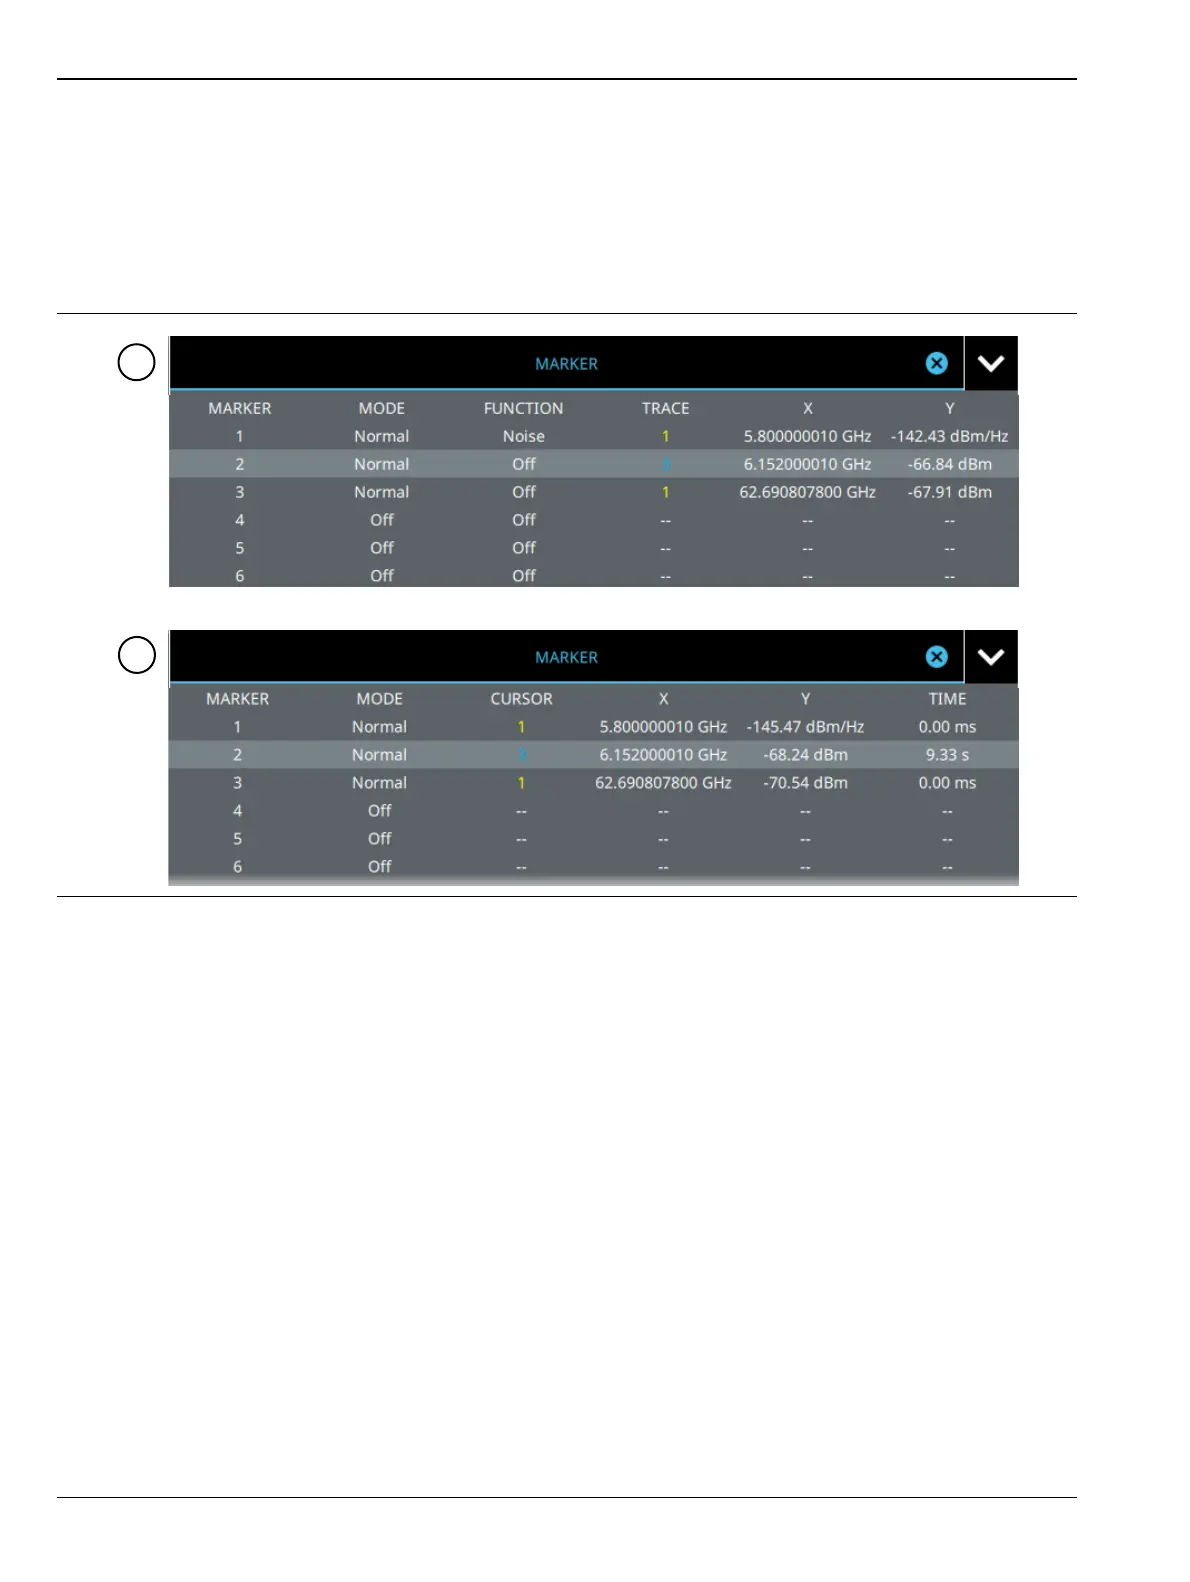
Marker Table
The marker table display is useful for displaying many marker parameters at once. The examples shown are
for the regular Spectrum view (1) and for Spectrogram view (2). Both marker tables show the marker mode and
corresponding X and Y values. In spectrum view, the marker table shows the marker function and trace to
which it is selected. In Spectrogram view, the marker table shows the time value and the cursor to which it is
selected. The selected marker is displayed with a highlighted background. Table controls are located on the
right of the header. Select the down or up arrow to collapse or expand the table, press X to close the table.
You can select and change a marker’s parameters by selecting the marker from either the MARKER menu or
the MARKER table.
The currently selected marker’s value is shown at the top left of the spectrum window with its current
amplitude and frequency values.
The selected marker is highlighted on the trace display.
Figure 3-37. Marker Table