Spectrum Analyzer Measurements 3-9 Setting Up Markers
Spectrum Analyzer MG PN: 10580-00447 Rev. H 3-49
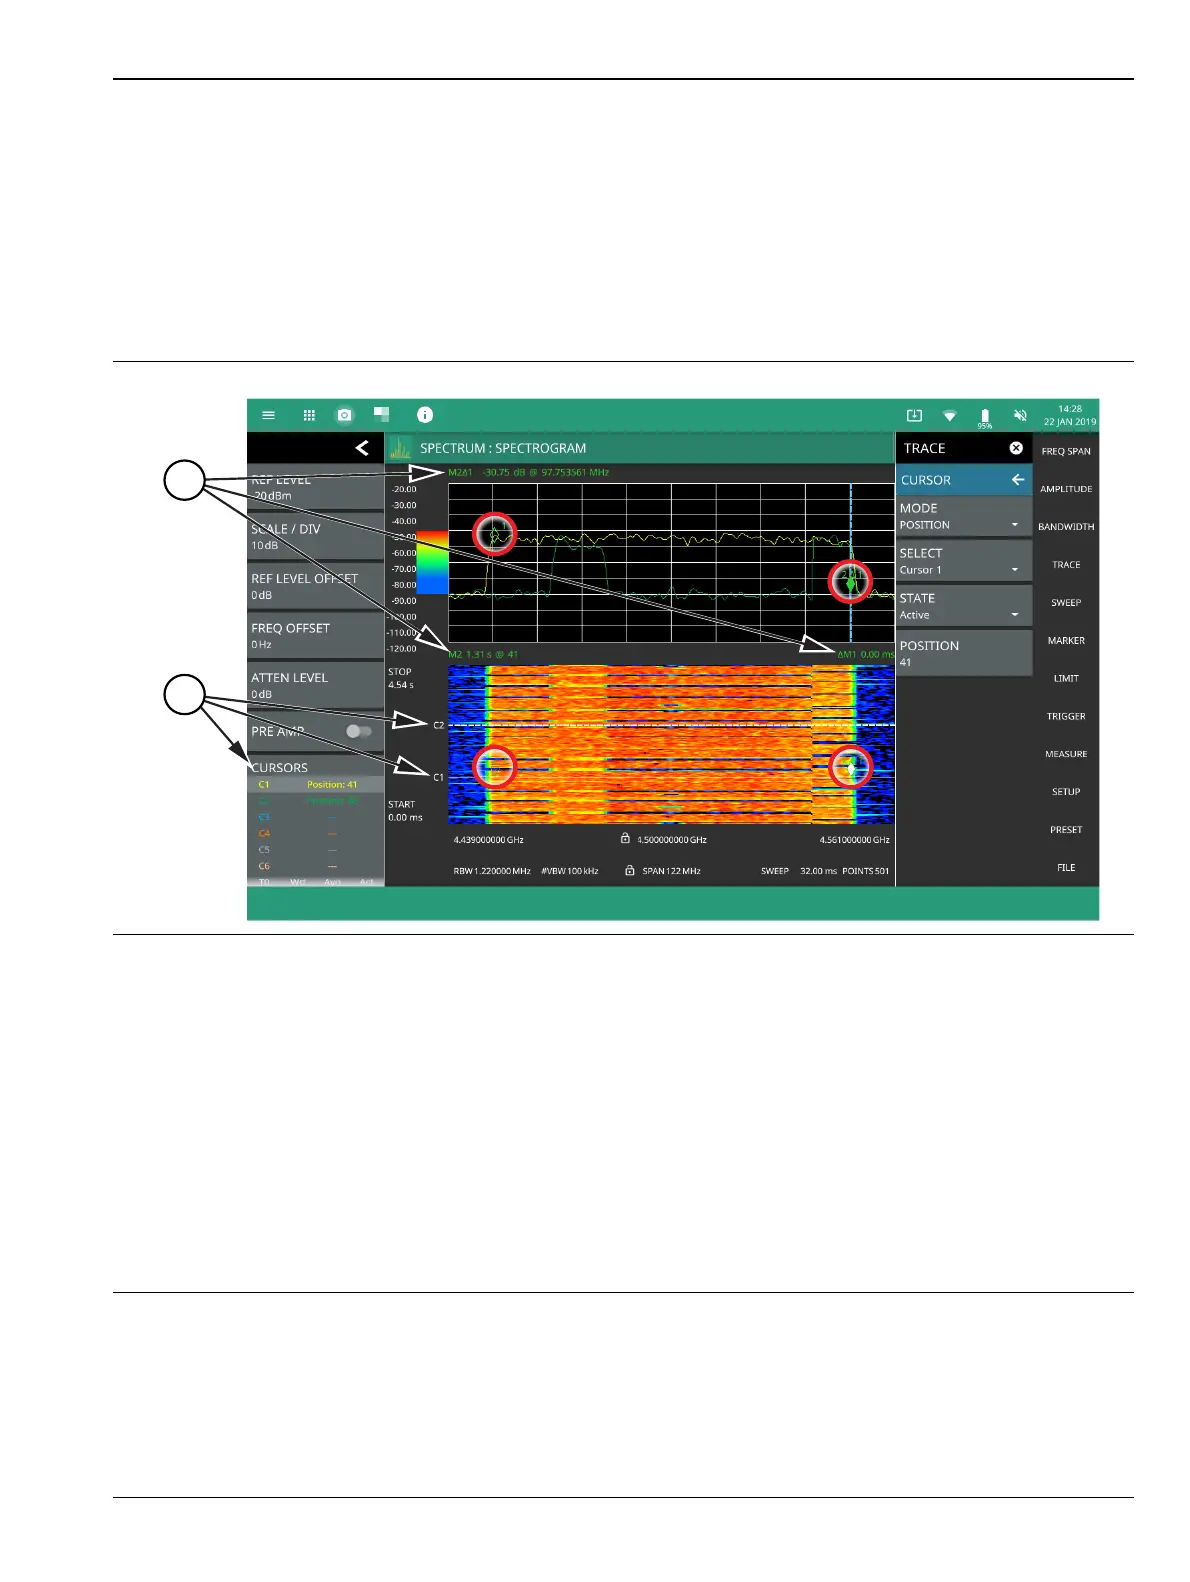
Spectrogram with Cursors and Markers
In the spectrum window, markers are shown as hollow green diamonds on the trace to which they are
assigned. Active markers have a solid fill with a vertical dashed line that can be used to drag the marker
position. The dashed line matches the trace color to which the marker is assigned. In the spectrogram window,
markers are shown as hollow green diamonds on the cursor to which they are assigned. The active marker is
shown with white fill and its time and position values are displayed in green text at the upper left side of the
display. In this example, the active marker is set to Cursor C2 and is measuring a change of amplitude
between two different points in time. Markers can be placed on different cursors to help you compare
measurements at different points in time as well as frequency.
1. Markers: Displays the selected marker value. Marker values at the top of the spectrum display will show the
current frequency and amplitude values of the active marker and its type. In this case, marker 2 is set to a delta
marker relative to Marker 1. Marker values at the top of the spectrogram window show the current time or
position of the active marker (left) and other marker information such as delta time (right). In this case, marker 2
is active and is at position 41 and has a relative time delta of 0 ms. Note that you can set a marker on any cursor
to measure relative time differences between signal events as well as frequency and amplitude differences.
Markers displayed on traces and cursors (encircled in red) show as green diamonds with the active marker in
white fill.
2. Cursors: Cursors are shown on the spectrogram as white dashed lines. The active cursor is a solid white line.
Cursors can be directly selected and dragged to position on the display or set via the TRACE > CURSOR menu.
Cursors and their settings can also be accessed via the status panel. The start time is the most recent
completed sweep and the beginning of the spectrogram. The stop time is the total time length of the
spectrogram, essentially the amount of time it takes for a completed sweep to get from the bottom to the top of
the spectrogram diagram with the current settings.
Figure 3-36. Spectrogram with Cursors and Markers
1
2