3-8 Setting Sweep Parameters Spectrum Analyzer Measurements
3-42 PN: 10580-00447 Rev. H Spectrum Analyzer MG
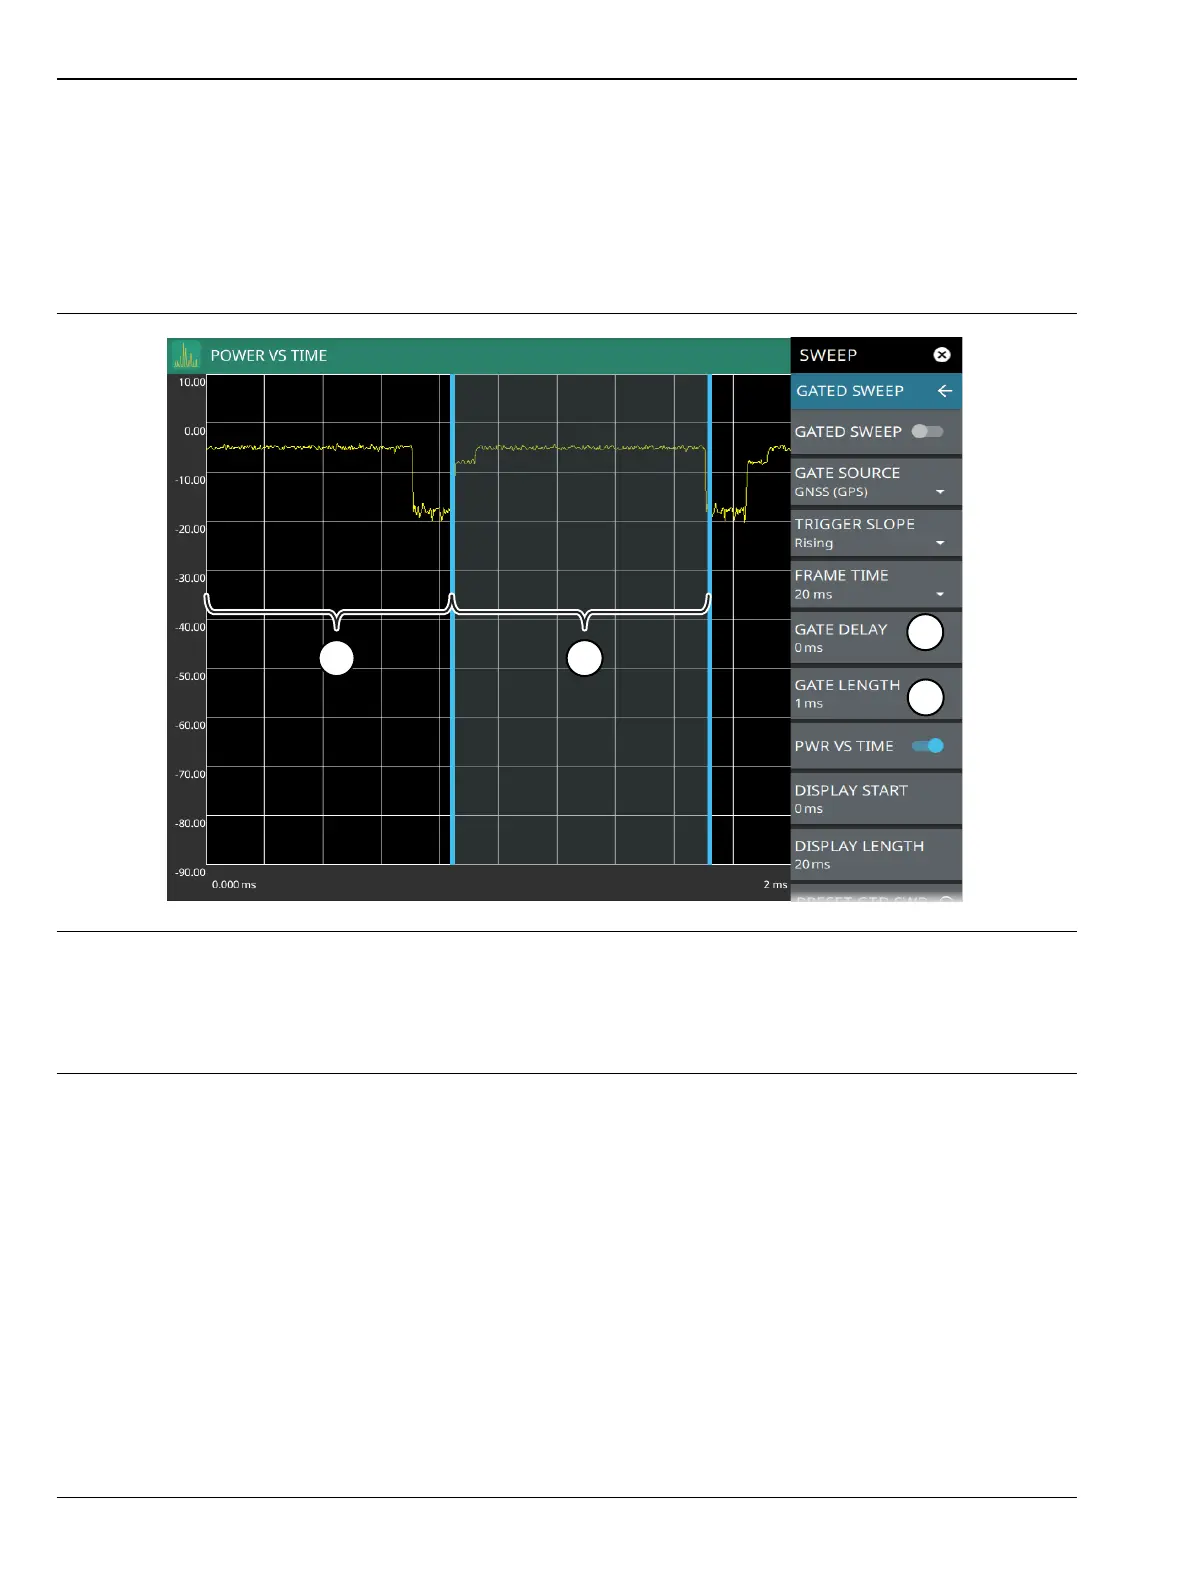
POWER VS TIME Display
When power vs time is enabled, a time-domain graph is presented. This graph is a useful visual aid when
setting up the GATE DELAY (1) and GATE LENGTH (2) times as you can simultaneously view the signal level
within the set frame and relative to your gate delay and length. The display is enabled using the
PWR VS TIME toggle setting and should be disabled after setting up the gate delay and length parameters.
The gate delay and length are represented by the width of the displayed shaded area flanked with blue lines
(see Figure 3-31).
If the blue gate delay and length setting lines are set outside of the displayed graticule scale, you will see
“< Gate Start” and “Gate Stop >” messages at the edge of the display indicating where the blue setting lines
are located.
Once the gate has been set up, you can apply gating to the spectrum by toggling GATED SWEEP on. Gating
will continue to be applied when you access other measurements and functions of the spectrum analyzer until
gated sweep is toggled off or an unsupported instrument configuration is selected.
1. Set the gate delay by dragging the left blue setting line or entering a value directly. The full time scale is shown
along the bottom and the gate delay time will be displayed at the top center of the graticule when it is being
adjusted.
2. Set the gate length by dragging the right blue setting line or entering a value directly. The full time scale is shown
along the bottom and the gate length will be displayed at the top center of the graticule when it is being adjusted.
Figure 3-31. Power vs. Time Display