3-19 Coverage Mapping (Option 431) Spectrum Analyzer Measurements
3-96 PN: 10580-00447 Rev. H Spectrum Analyzer MG
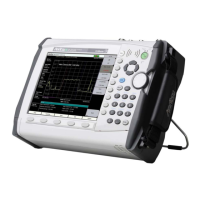
STATUS PANEL (Coverage Mapping)
The status panel illustrated in Figure 3-78 is unique to the coverage mapping measurement.
START MEAS: Initiates a coverage mapping measurement. A valid GPS
antenna must be connected to the instrument and enabled for a measurement
data to be recorded. Note that the START MEAS button also appears on the
“MEASUREMENT Menu (Coverage Mapping)” on page 3-95 and provides the
same functionality.
SELECT POINTS: Toggle this button to view the value and signal quality of the
current measurement.
Color-Coded Legend: This legend shows the colors that are assigned for each
power level threshold. Note that at the end of coverage mapping drive, the legend
shows the percentage of breadcrumbs for each of the defined power levels. The
power levels can be set using the “COLOR SETUP Menu (Coverage Mapping)”
on page 3-98.
For example, if the power threshold value of the received signal is greater than or
equal to -40 dBm, it is indicated in blue color (excellent). If the power value is less
than -55 dBm it is indicated in pink color (poor).
CENTER FREQUENCY: Sets the center frequency of the sweep range. The
current span setting will remain constant or will be adjusted to accommodate the
start and stop frequency range of the instrument. The center frequency can also
be dragged on the display when gestures are not toggled off.
SPAN: Sets the sweep frequency range. The current center frequency will
remain constant and the start and stop frequencies will be adjusted to
accommodate the new range. Selecting the plus (+) or minus (–) control
increments the span value in a 1:2:5 sequence. The span can also be changed by
pinching the trace in or out when gestures are not toggled off.
AUTO RBW: When toggled on, the instrument selects the resolution bandwidth
based on the current span width. The ratio of span width to RBW can be specified
using the SPAN:RBW button.
RBW: The current resolution bandwidth is displayed under the RBW button.
Once auto RBW is toggled off, the RBW can be changed using the keypad or the
slider controls. Bandwidth values increment in a 1:3:10 sequence, from 1 Hz to
3 Hz to 10 Hz or from 10 Hz to 30 Hz to 100 Hz, for example. Refer to your
instrument technical data sheet for the resolution bandwidth range.
DETECTOR TYPE: Selects one of the available detector types. Several
detection methods tailor the function of the instrument to meet specific
measurement requirements. There are often more measurement points across
the screen than display points. The various detection methods are different ways
of showing each display point (see “Trace Detector Types” on page 3-26).
Figure 3-78. STATUS Panel (Coverage Mapping) with Mini Status Panel Icons
 Loading...