IA Spectrum Analyzer (Option 24) 4-4 Interference Map
Spectrum Analyzer MG PN: 10580-00447 Rev. H 4-7
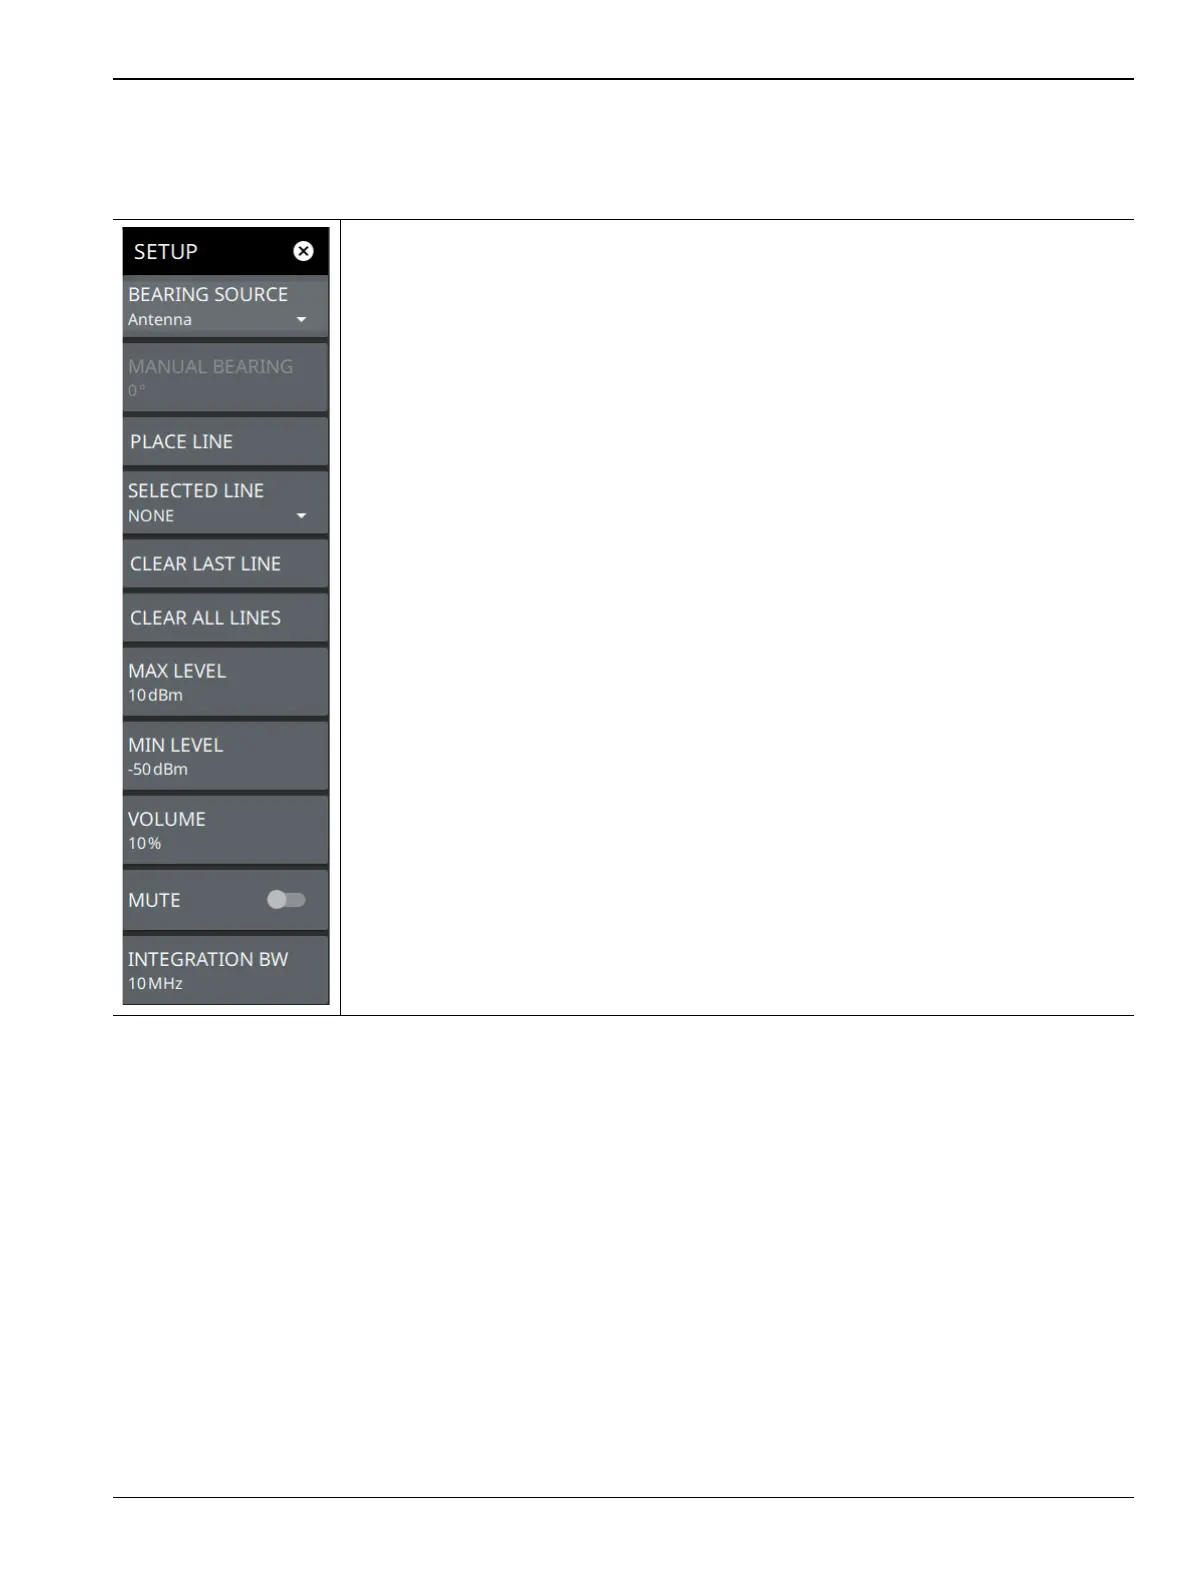
SETUP Menu (Interference Map)
The Interference Map SETUP menu is available in MEASURE > MEASUREMENT > Interference Map>
SETUP.
BEARING SOURCE: Selects the bearing source either as antenna or manual. If antenna
is selected the electronic compass from the MA2700A InterferenceHunter is used to find
the direction of the peak signal. If MANUAL is selected an external compass must be
used to find the direction of the power signal.
MANUAL BEARING: Allows the user to manually enter the number of degrees from true
north direction of the peak signal. In this case, a magnetic compass or a compass App
installed in a smart phone can be used to find the direction of the peak signal.
Note that if an antenna that is less than 6 GHz range is used, then an external magnetic
compass may be used to find the signal direction. The eCompass in MA2700A does not
support in locating high frequency signals. Manual bearing feature is very useful when
triangulating signals greater than 6 GHz, as the user is allowed to enter the bearing
manually.
PLACE LINE: Places the bearing line data in red on the map, alternatively press the
trigger on the MA2700A InterferenceHunter to place the red line on the map.
SELECTED LINE: Selects a desired line of your choice.
CLEAR LAST LINE: Clears the lastly placed line.
CLEAR ALL LINES: Clears all the bearing line data from the map.
MAX LEVEL: Sets the upper level for the audio response of the measurement. This
setting is useful for adjusting the resolution of the tone changes. Power levels above the
MAX LEVEL will continue to emit sound an increasingly higher pitch.
MIN LEVEL: Sets the lower level for the audio response of the measurement. The MIN
LEVEL also functions as a squelch. Power below this level will not emit a sound.
VOLUME: Adjusts the audio output volume.
MUTE: Mutes the instrument volume.
INTEGRATION BW: Sets the range of integration used in calculating the received
power. The integration bandwidth is displayed as the shaded region between the
bandwidth start and stop thresholds (dashed green lines).
Figure 4-6. SETUP Menu (Interference Map)