2-2 Selecting the Analyzer Spectrum Analyzer Overview
2-4 PN: 10580-00447 Rev. H Spectrum Analyzer MG
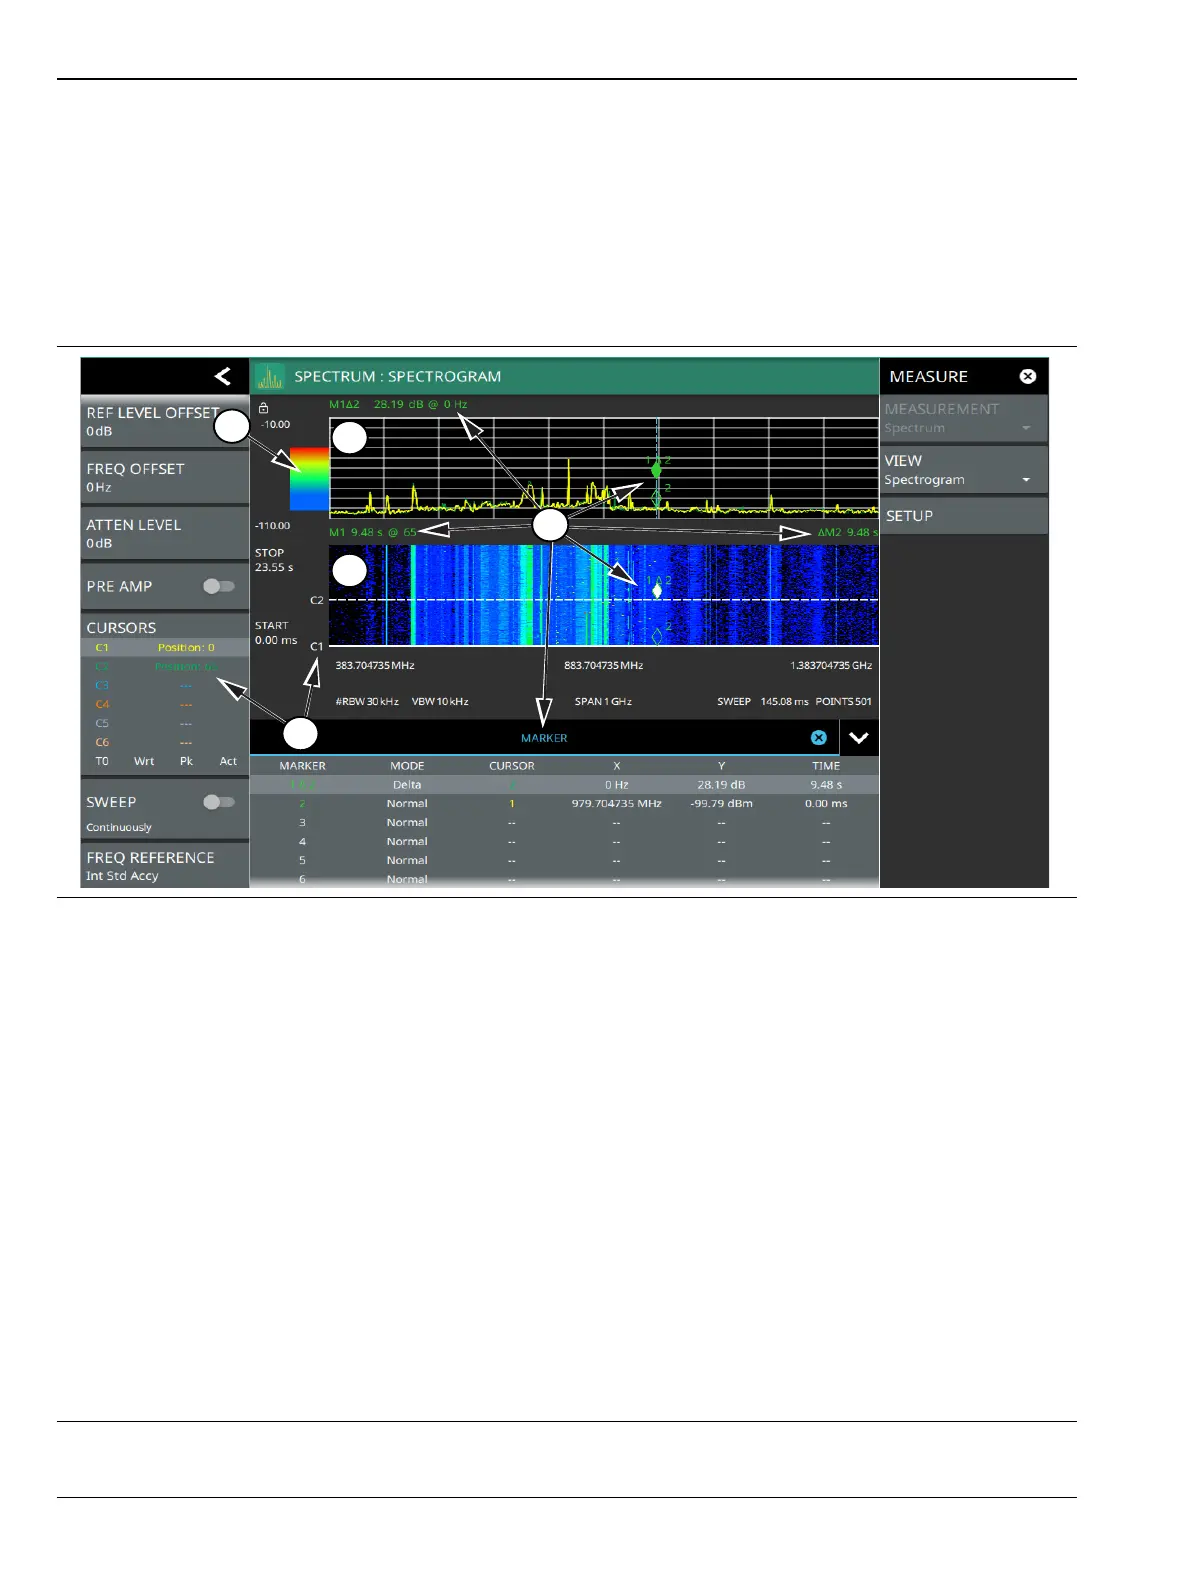
Spectrogram View
Spectrogram view is useful for identifying intermittent signals and for providing historical signal data in a
comprehensive view. It provides a multi-dimensional “waterfall” display representing frequency, time, and
amplitude. Frequency and time are shown on a typical two-dimensional scale while amplitude is displayed in
the color dimension. The color is set by adjusting the color range of the color bar.
Select Spectrogram view from MEASURE > VIEW > Spectrogram. Once Spectrogram view is selected, the
color bar can be configured from the SETUP menu. Refer to “SETUP Menu (Spectrogram View)” on page 3-118
for more information on setting up the Spectrogram view.
1. Color Bar: The color bar is used to adjust the colors displayed at different amplitude levels. The color bar shown
here represents the range of colors that will be displayed. This bar can be dragged up or down to adjust the
coverage area. If signals or noise is outside of the color bar range, then black is displayed. The color bar top and
bottom setting, and the overall hue to the color range is set via the “SETUP Menu (Spectrogram View)”
on page 3-118, which can be opened by pressing the color bar.
2. Spectrum Window: The upper display area shows spectrum trace data in the frequency domain. Up to six
traces can display data from different times depending on how the corresponding cursors are set in the
spectrogram display below. Note that the spectrum display shows trace amplitude (vertical axis) data in the time
(horizontal axis) domain.
3. Spectrogram Window: The lower display area shows spectrogram trace data in the time (vertical axis),
frequency (horizontal axis), and amplitude (color) domains. The bottom of the spectrogram displays the current
sweep at the current time (0 ms) or position 0. When a sweep completes, the entire display is shifted up and the
new trace is added to the bottom of the spectrogram. The spectrogram holds 142 sweeps (cursor positions) and
the stop time reflects the time taken to complete all of the sweeps.
4. Cursors (C1 to C6): Cursor information for the currently set cursor type (time or position) is shown in the status
panel. Cursors are shown on the spectrogram as white lines at the currently set cursor time or position. Refer to
“Spectrogram with Cursors and Markers” on page 3-49.
5. Markers: Marker and marker data are shown in a variety of locations. Markers can be placed on different
cursors to help you compare measurements at different points in time as well as frequency. Refer to
“Spectrogram with Cursors and Markers” on page 3-49.
Figure 2-3. Spectrogram View