Spectrum Analyzer Measurements 3-7 Setting Trace Parameters
Spectrum Analyzer MG PN: 10580-00447 Rev. H 3-29
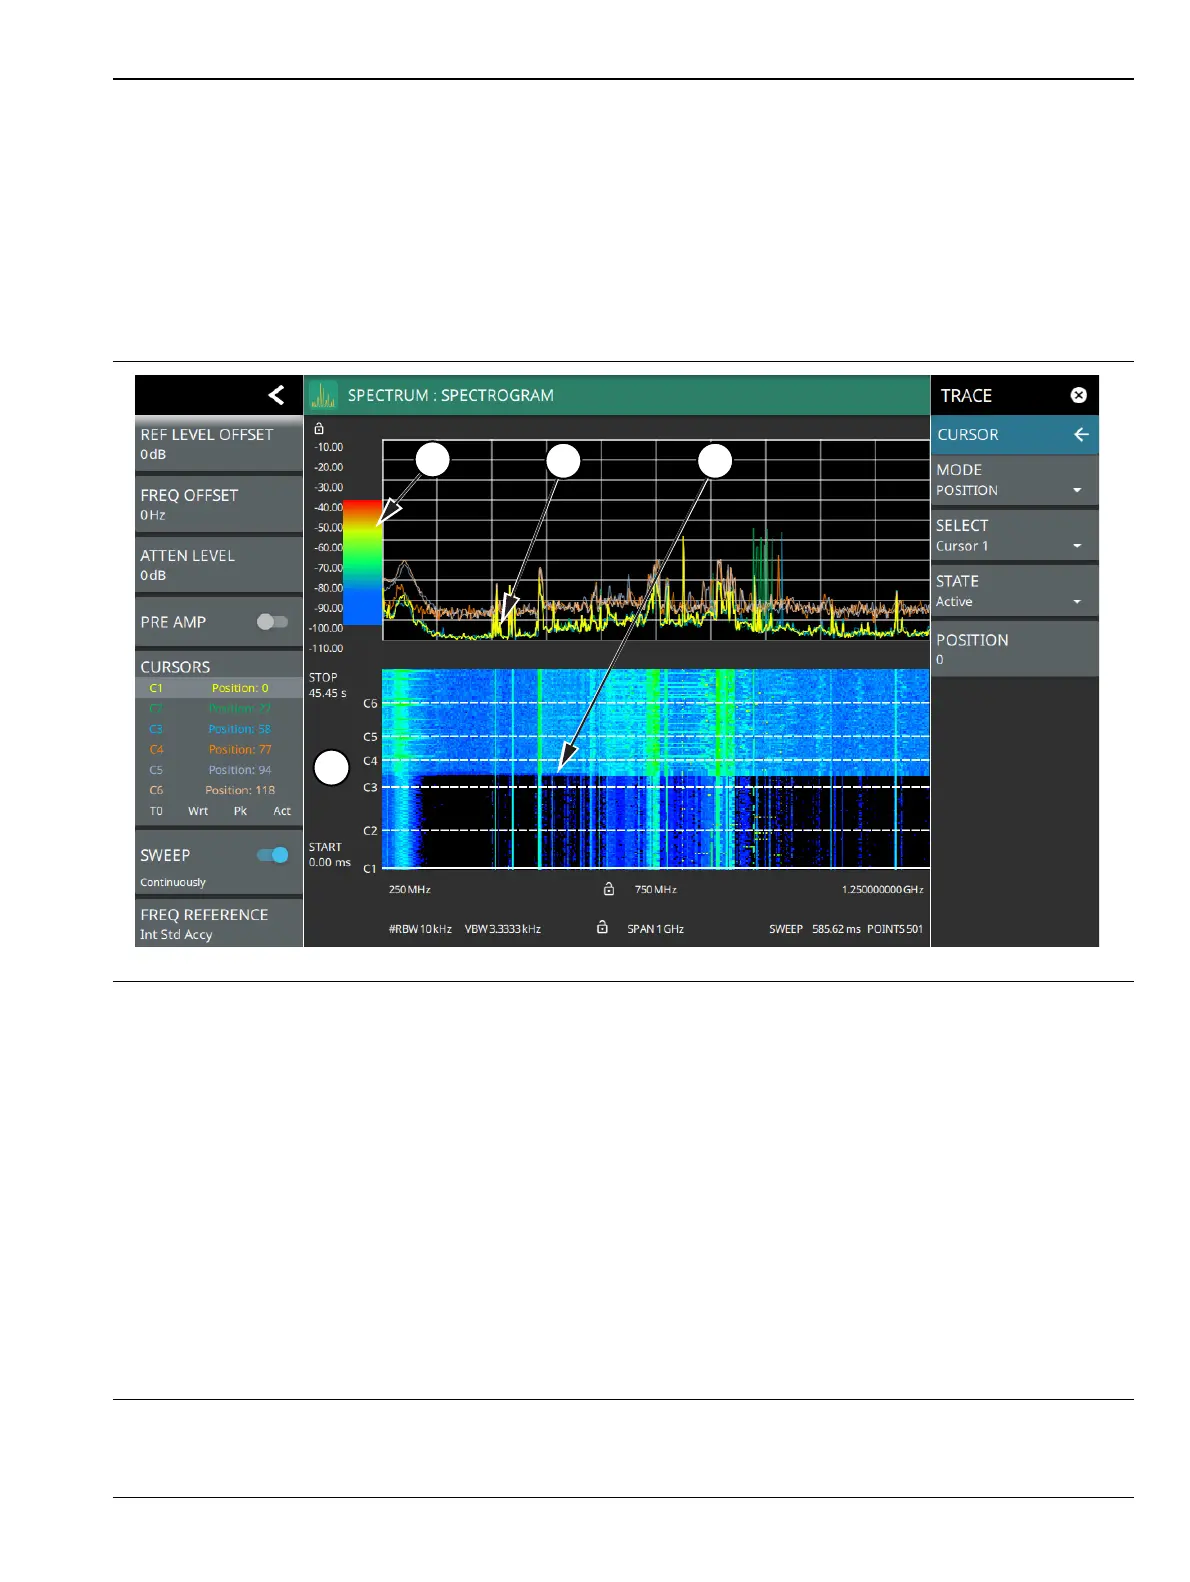
Cursors in Spectrogram View
The figure below shows the instrument with all six cursors enabled on a signal. Cursors are shown on the
spectrogram as white lines. The active cursor is a solid white line and other cursors show as dashed white
lines. Cursors can be directly selected and dragged to position on the display or set via the TRACE > CURSOR
menu. Cursors and their settings can also be accessed via the left side status panel by touching a cursor in the
CURSORS table. The START time is the most recently completed sweep and the beginning of the spectrogram
display. The STOP time is the total time length of the spectrogram, essentially the amount of time it takes for
all completed sweeps to progress from the bottom to the top of the spectrogram window. The stop time will vary
depending on the sweep speed, which can be faster or slower depending on settings such as span and RBW.
1. Color Bar settings are used to adjust the colors displayed at different amplitude levels. The color bar shown here
represents the range of colors that will be displayed. This bar can be dragged up or down to adjust the coverage
area. If signals or noise is outside of the color bar range, then black is displayed. The color bar top and bottom
setting, and the overall hue to the color range is set via the “SETUP Menu (Spectrogram View)”
on page 3-118.
2. The traces shown in Spectrogram view are updated when the data in the spectrogram lands on the associated
cursor. The traces show sweep data from that respective point in time. The bandwidth and amplitude settings in
the example above were changed. Traces 1 through 3 reflect the changed settings while traces 4 through 6 are
showing sweep data from earlier points in time. To freeze the spectrogram, stop the instrument from sweeping
by toggling off Sweep Continuously.
3. The transition in the spectrogram here shows when the amplitude and bandwidth settings were changed.
4. The spectrogram START and STOP times shown here represent the full duration of all 142 sweeps shown in the
spectrogram window. Cursors 1 through 6 are positioned throughout the spectrogram and can be dragged or set
to a new time or position using the “” on page 3-31. Cursors can also be selected via the left side status menu
CURSORS table. The bottom of the table shows the reference trace (T0) and its settings. The reference trace
setting applies to all traces shown in the spectrum display.
Figure 3-21. Cursors – Spectrogram View