Spectrum Analyzer Measurements 3-7 Setting Trace Parameters
Spectrum Analyzer MG PN: 10580-00447 Rev. H 3-21
3-7 Setting Trace Parameters
The instrument can display up to 6 traces simultaneously. Traces can be enabled from the TRACE menu by
selecting the trace from the available selections, or you can select a trace in the Status panel to make it active.
Each trace can have a separate trace type, mode, and detector. When working with traces in RF spectrum view,
refer to “TRACE Menu (Spectrum View)” on page 3-24. When working with traces and cursors in Spectrogram
view, refer to “TRACE Menu (Spectrogram View)” on page 3-30 and “” on page 3-31.
Traces in RF Spectrum View
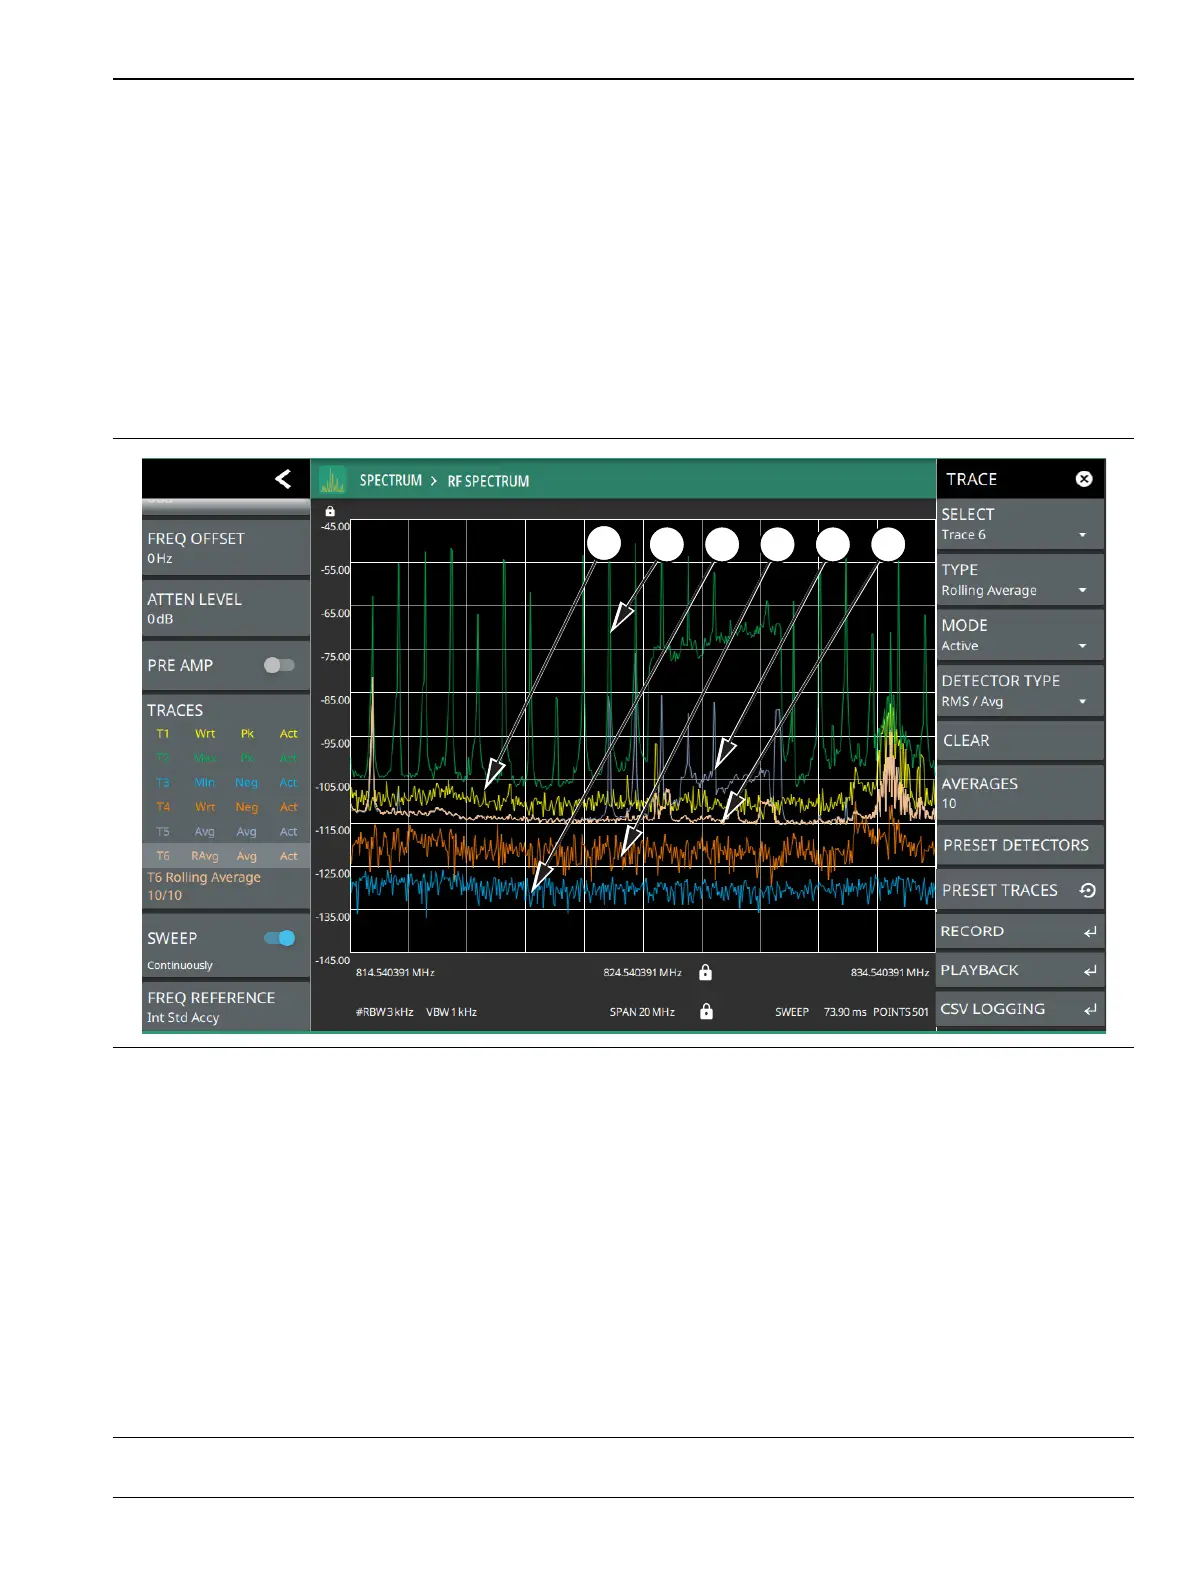
The figure below shows all six traces enabled on a signal, each with a different trace or detector type setting.
The left side status panel shows a trace setup summary table. Touching one of the trace rows in the table will
enable the trace and open the TRACE menu.
1. Clear/Write and Peak Detection: This is the default trace setting. The trace is cleared during each sweep and the
largest measurement point is used for each display point.
2. Max Hold and Peak Detection: Each trace point retains its maximum value and the largest measurement point is
used for each display point.
3. Min Hold and Negative Detection: Each trace point retains its minimum value and the smallest measurement
point is used for each display point.
4. Clear/Write and Negative Detection: Trace points are cleared during each sweep and the smallest measurement
point is used for each display point.
5. Average and RMS/Average Detection: The trace points are an average of the previous N sweeps, where N is
the AVERAGES setting. RMS/Average detection depends on the video bandwidth type setting (BANDWIDTH >
VBW TYPE): When VBW/AVERAGE type is set to Linear, this method detects the average power of
measurement points that go into the display point. When VBW/AVERAGE type is set to Logarithmic, the
traditional average of log (power) is displayed.
6. Rolling Average: The rolling average of the last N traces, where N is the AVERAGES setting.
Figure 3-12. Traces – RF Spectrum View