3-7 Setting Trace Parameters Spectrum Analyzer Measurements
3-22 PN: 10580-00447 Rev. H Spectrum Analyzer MG
Trace Math in RF Spectrum View
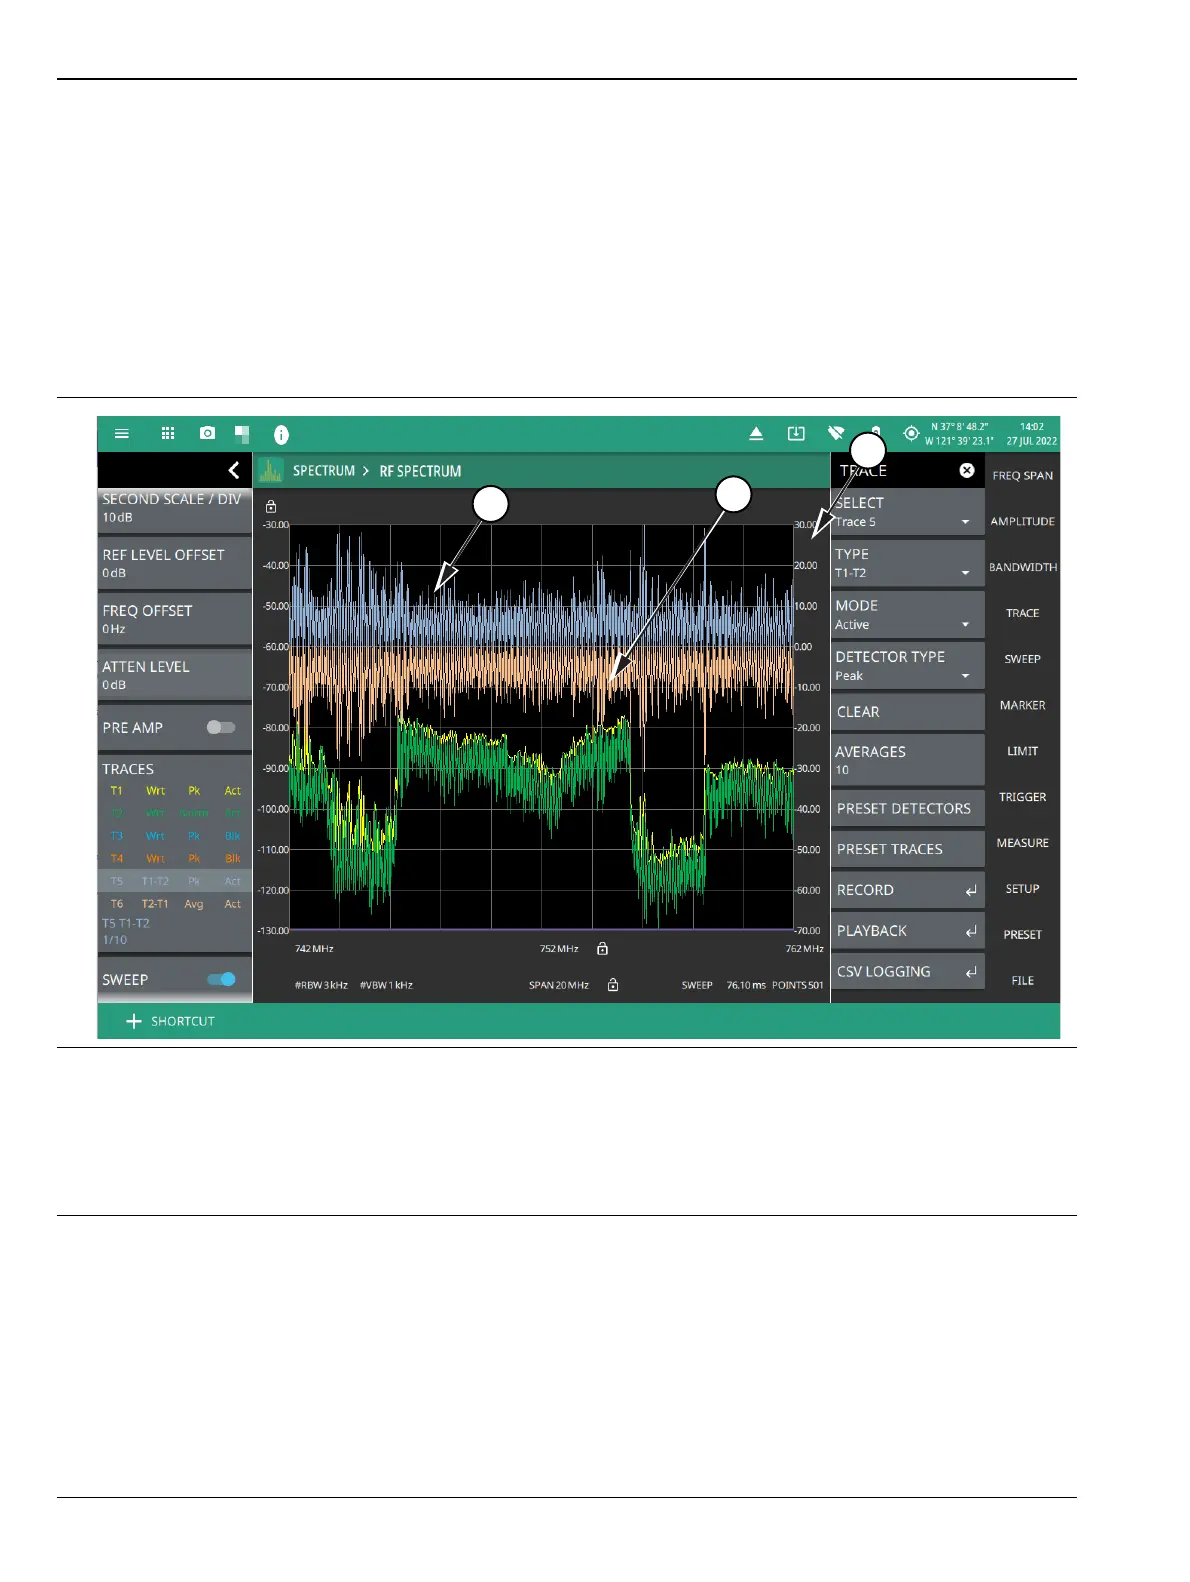
The figure below shows the instrument with trace 5 and 6 enabled on a signal, each with a different trace or
detector type setting. The left side status panel shows a trace setup summary table. Touching one of the trace
rows in the table will enable the trace and open the TRACE menu. In trace math, the T2-T1 or T1-T2 operation
performs a division of the linear powers (watts) of trace 2 divided by trace 1 and vice versa, this is equivalent to
the subtraction of the log powers (dBm). The operation does not change depending on the amplitude units and
the resulting math trace is always in dB. When a math trace enabled, a secondary Y axis appears on the right
side of the trace window. Most measurements are incompatible with dB values and will stop updating when a
math trace is the active trace. Limit lines on math traces interpret their values as (dB).
7. T1-T2: Appears only when Trace 5 is enabled. When selected displays the difference between T1 and T2, in
addition to the second Y axis on the right hand side.
8. T2-T1: Appears only when Trace 6 is enabled. When selected displays the difference between T2 and T1, in
addition to the second Y axis on the right hand side.
9. Second reference level: Appears only when Trace 5 or 6 are selected and Trace Type is set as either T1-T2 or
T2-T1.
Figure 3-13. Trace Math – RF Spectrum View