3-7 Setting Trace Parameters Spectrum Analyzer Measurements
3-28 PN: 10580-00447 Rev. H Spectrum Analyzer MG
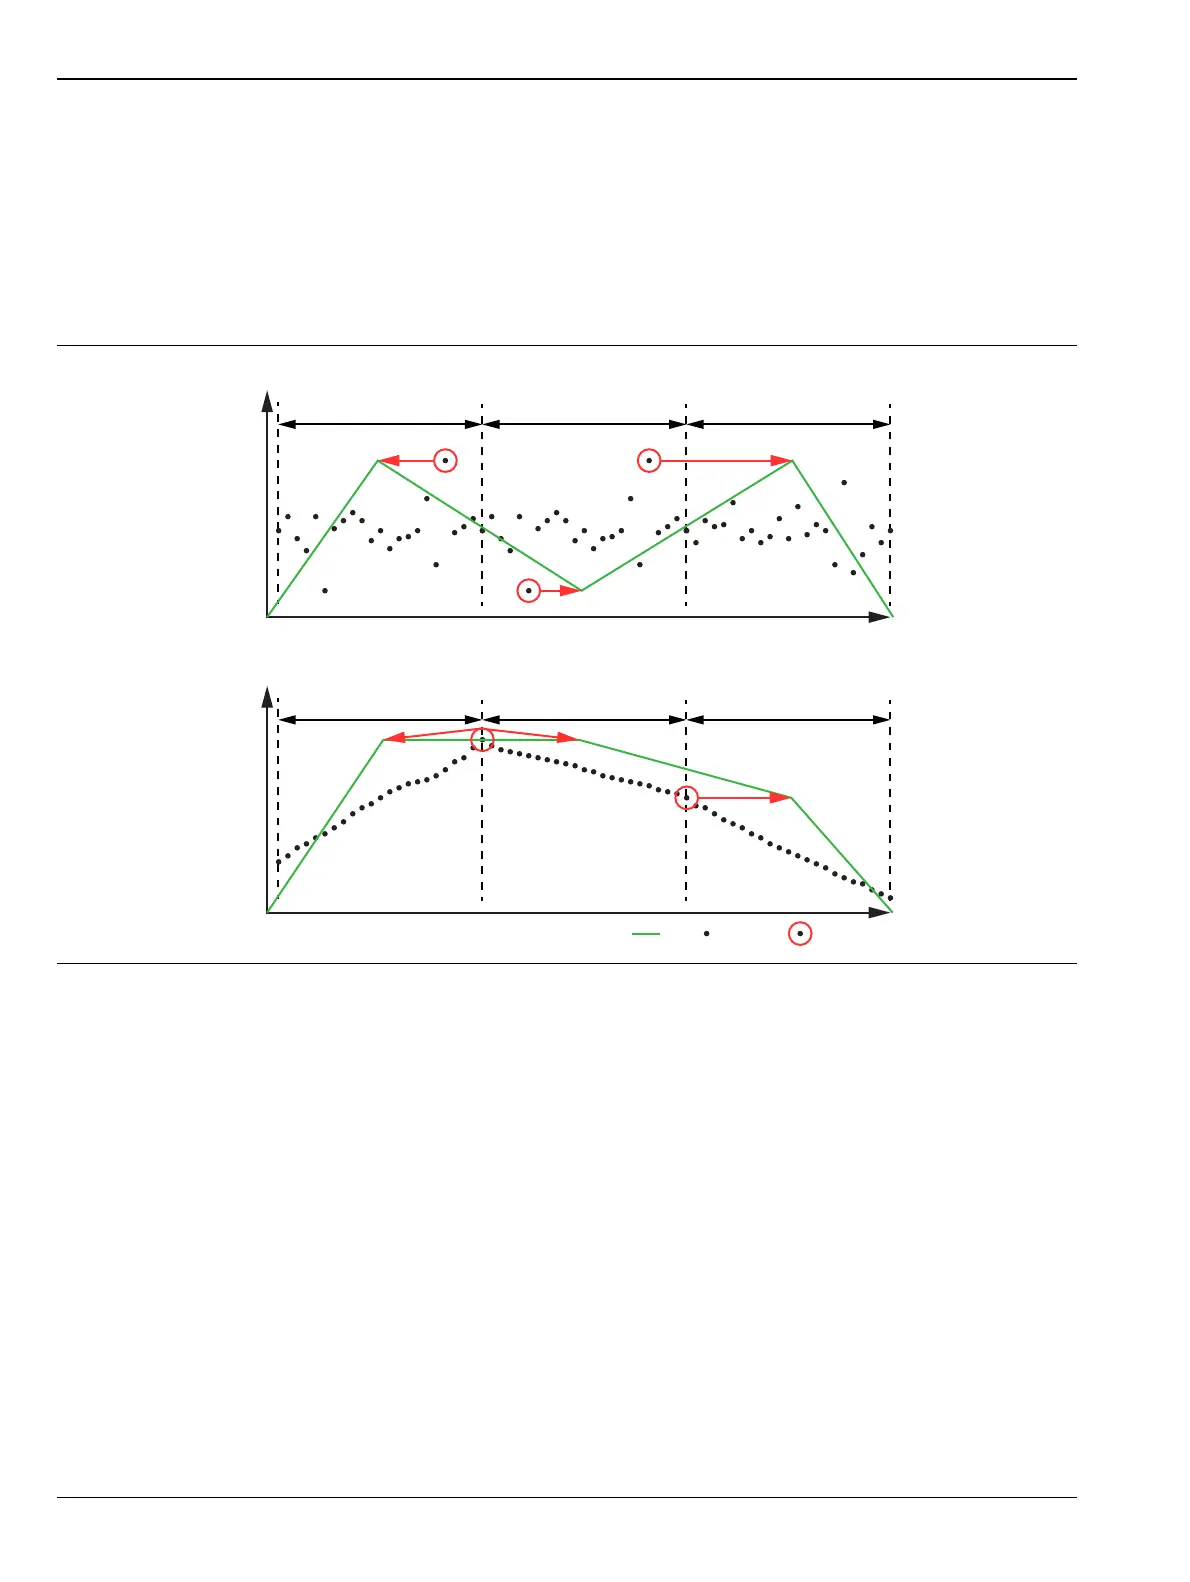
Normal
Shows random noise and signal data depending on the nature of the sampled data. If the signal both rises and
falls during the sampling interval (random noise), then odd-numbered sampling intervals display the
maximum value and even-numbered sampling intervals display the minimum value. Odd-numbered sampling
intervals will display the peak value of the previous even-numbered sampling interval when the peak there is
higher. If the signal only rises or only falls during the sampling interval (signal), then only the peak value is
displayed, and Normal detection is then equivalent to Peak detection.
Figure 3-20. Normal Detector Type
Frequency/Time
Normal Detection (Noise)
Odd Display Point Sampling Interval
Amplitude
Even Display Point Sampling Interval Odd Display Point Sampling Interval
Normal Detection (Signal)
Odd Display Point Sampling Interval
Amplitude
Even Display Point Sampling Interval Odd Display Point Sampling Interval
Frequency/Time
Selected Data PointData PointTrace