Instrument Overview 2-7 GUI Overview
MS2090A UG PN: 10580-00444 Rev. U 2-11
2-7 GUI Overview
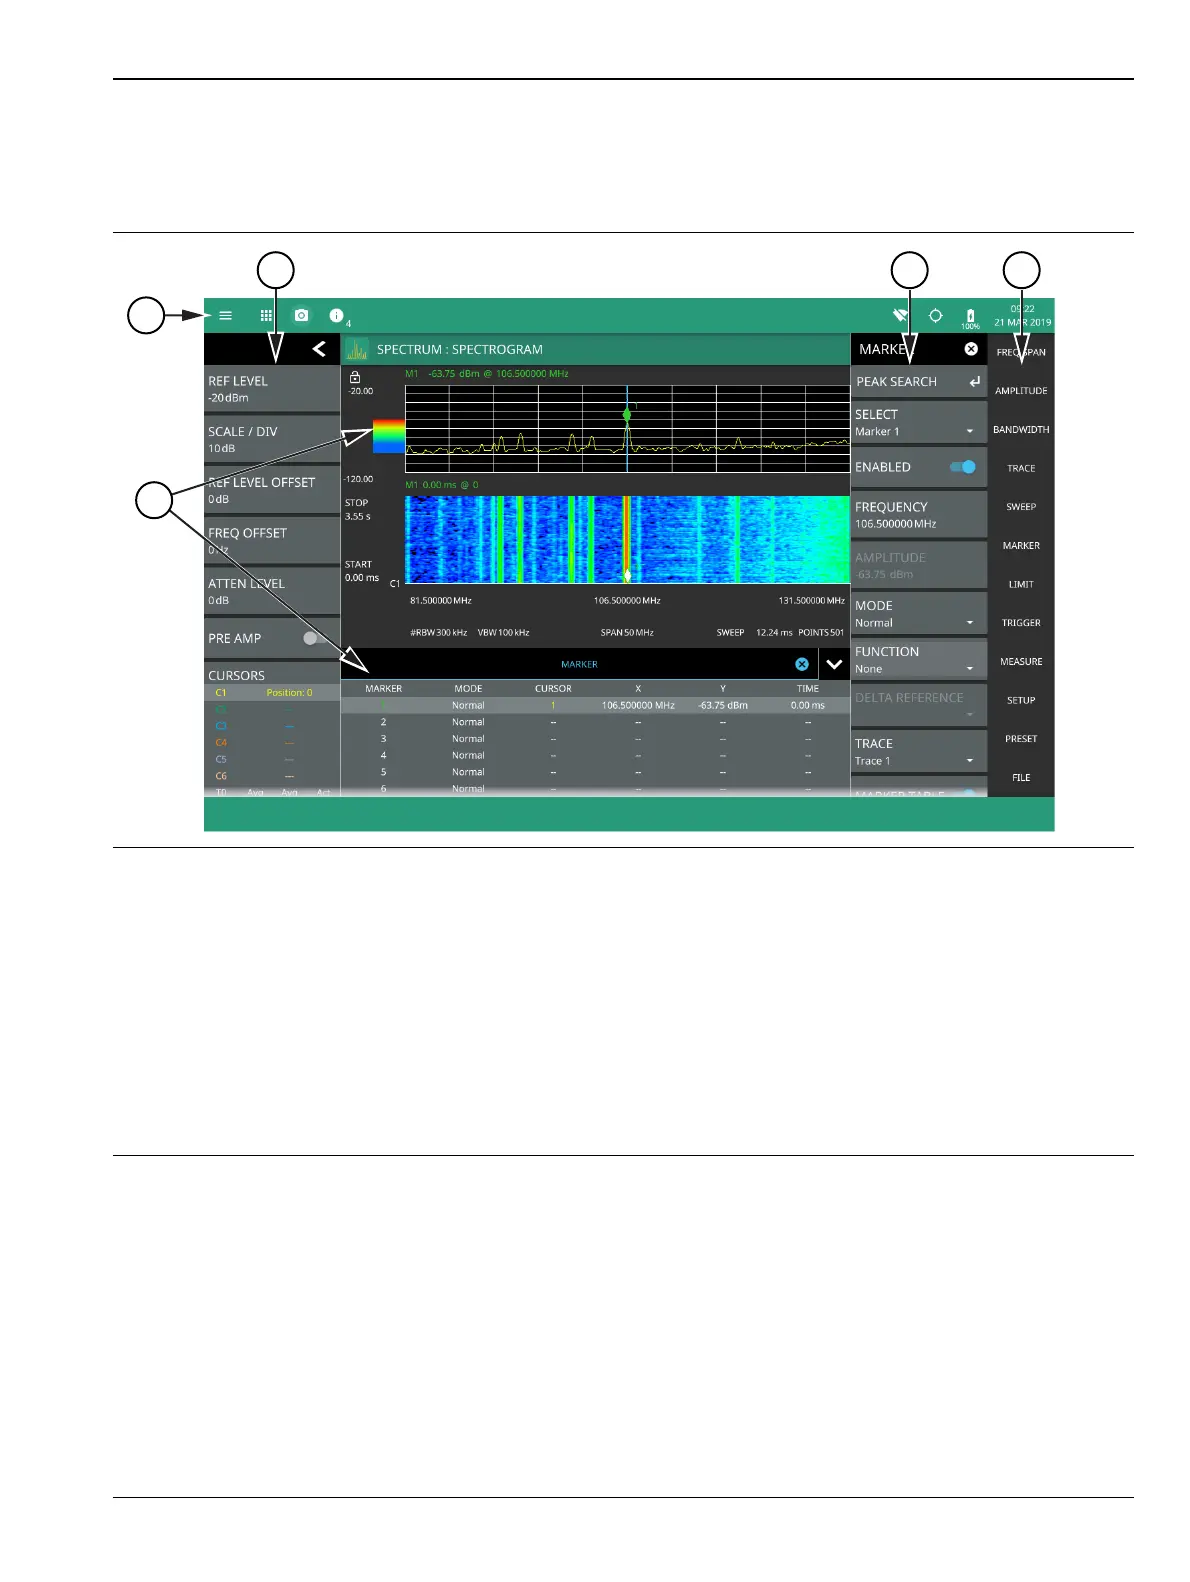
The MS2090A Field Master Pro software controls all instrument functions. The software runs locally on the
instrument and primary operation is through the touch screen display. The figure below identifies the main
display areas, which are each described in more detail later in this chapter.
1. The title bar provides quick access to system settings, measurement mode selection, informational dialogs, and
screen capture.
2. The status and trace panel is used to show common settings and controls, and to provide trace and cursor
information. The information displayed on this panel depends on the current measurement and view settings.
Refer to the appropriate chapter in this guide for information about this panel.
3. Menus are used to configure measurement settings such as frequency, amplitude, and bandwidth, and to
enable measurement modes and views such as Spectrogram view, OBW, ACP, and SEM measurements.
4. The main menu provides access to setting menus and other instrument controls.
5. The upper area typically displays graphical data such as spectrum trace and spectrogram plots. The lower area
typically displays tabular measurement data such as marker data, demodulation results, or other measurement
data depending on the selected measurement.
Figure 2-6. GUI Overview (sample display elements)