Chapter 7 Verifying the Instrument Performance
Overview
Applied Biosystems 7300/7500/7500 Fast Real-Time PCR System Installation and Maintenance Guide 89
Notes
7
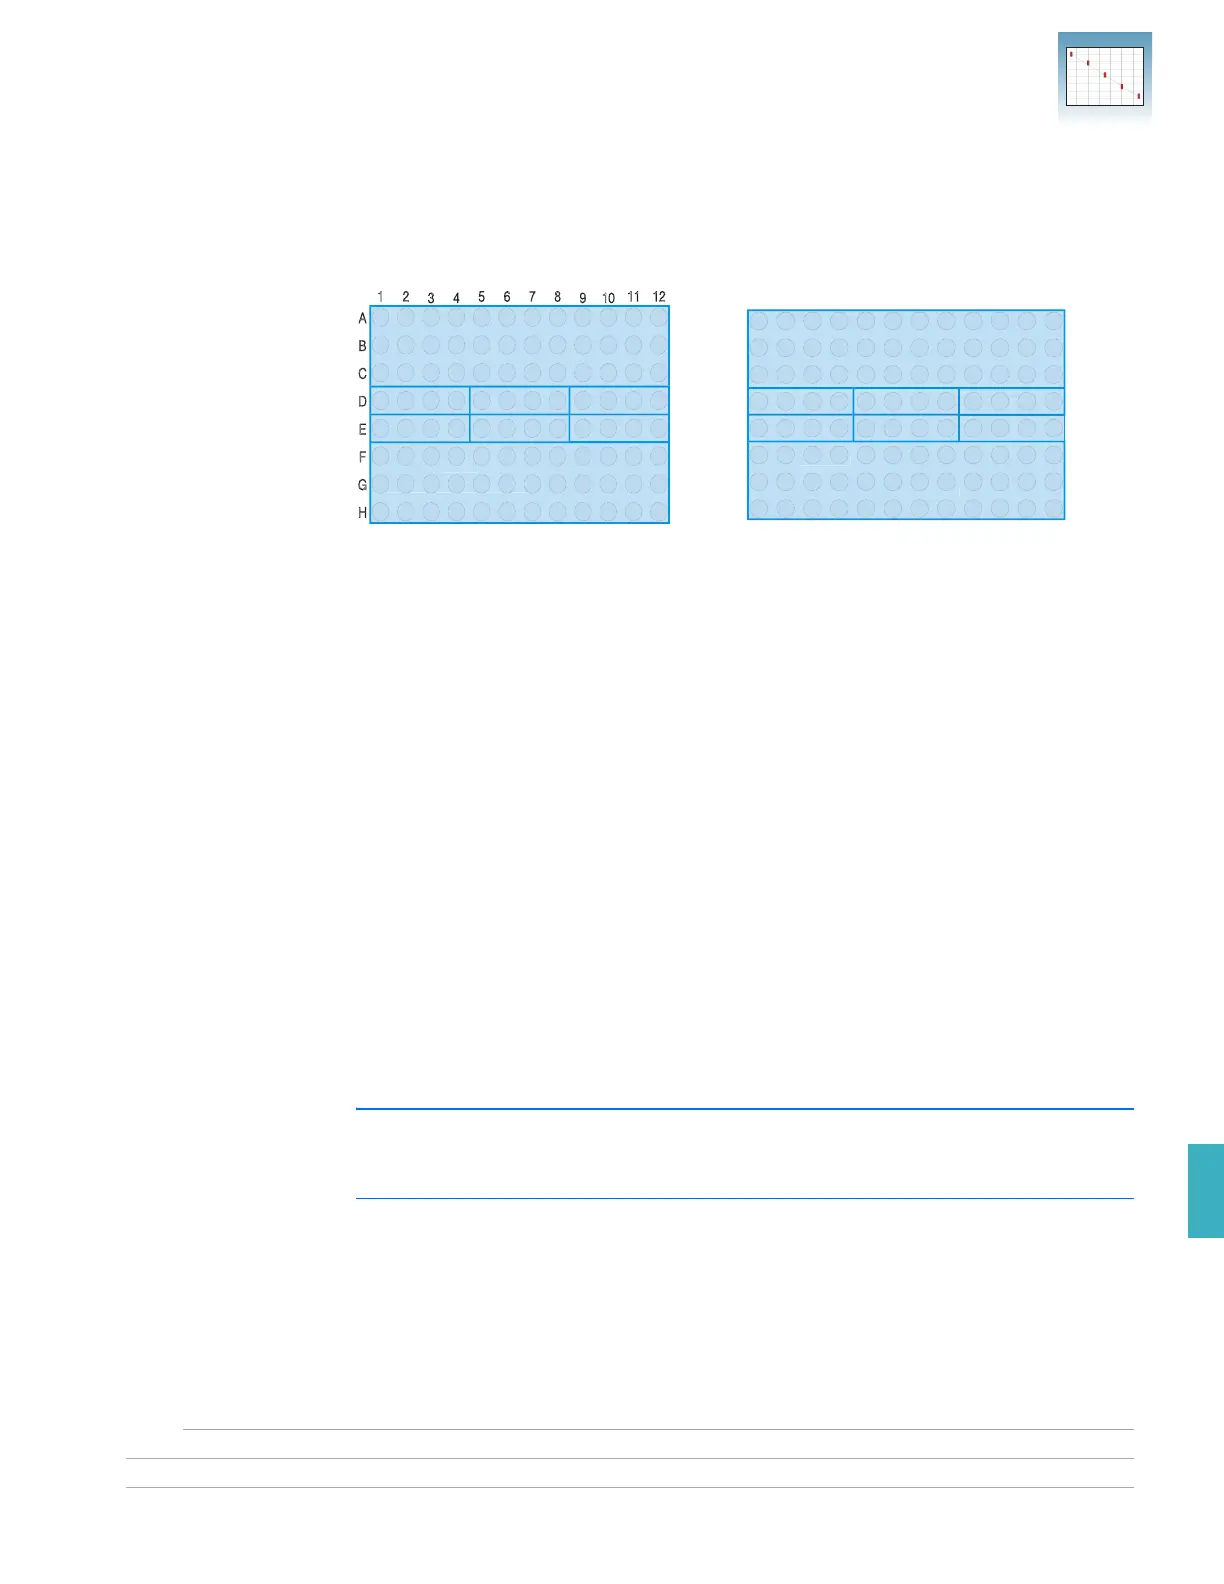
The figures below illustrate the arrangement of the standard and unknown populations
on the RNase P plate. The RNase P plate contains five replicate groups of standards
(1250, 2500, 5000, 10,000, and 20,000 copies), two unknown populations (5000 and
10,000 copies), and four no template control (NTC) wells.
After the run, the SDS software:
• Generates a standard curve from the averaged threshold cycle (C
T
) values of the
replicate groups of standards.
• Calculates the concentration of the two unknown populations using the standard
curve.
• Calculates the following using the mean quantity and standard deviation for the
5,000- and 10,000-copy unknown populations to assess the instrument
performance:
The instrument passes the verification if the analyzed data demonstrates that the
instrument distinguishes between 5,000 and 10,000 genome equivalents with a 99.7%
confidence level.
IMPORTANT! Up to six outlier wells from each unknown replicate group in a 96-well
TaqMan RNase P Instrument Verification Plate can be omitted from the analysis to meet
specifications.
GR2341
96-well plate one sample blue
5000-copy Unknown
Population 1
10000-copy Unknown
Population 2
NTC STD 1250 STD 2500
STD 5000 STD 10000 STD 20000
GR2478b
1
A
B
C
D
E
F
G
H
23456789101112
96-well plate one sample blue
RNase P
Population 1
RNase P
Population 2
NTC STD 1250 STD 2500
STD 5000 STD 10000 STD 20000
Plate for 7300/7500 system
Plate for 7500 Fast system
CopyUnk
2
()3 σ
CopyUnk2
()–[]CopyUnk
1
()3 σ
CopyUnk1
()+[]>
where:
•CopyUnk
1
= Average copy number of unknown #1 (5,000-copy population)
• σ
CopyUnk1
= Standard deviation of unknown #1 (5,000-copy population)
•CopyUnk
2
= Average copy number of unknown #2 (10,000-copy population)
• σ
CopyUnk2
= Standard deviation of unknown #2 (10,000-copy population)