Appendix C
Determining Optimum Dye Concentration
Applied Biosystems 7300/7500/7500 Fast Real-Time PCR System Installation and Maintenance Guide 129
Notes
C
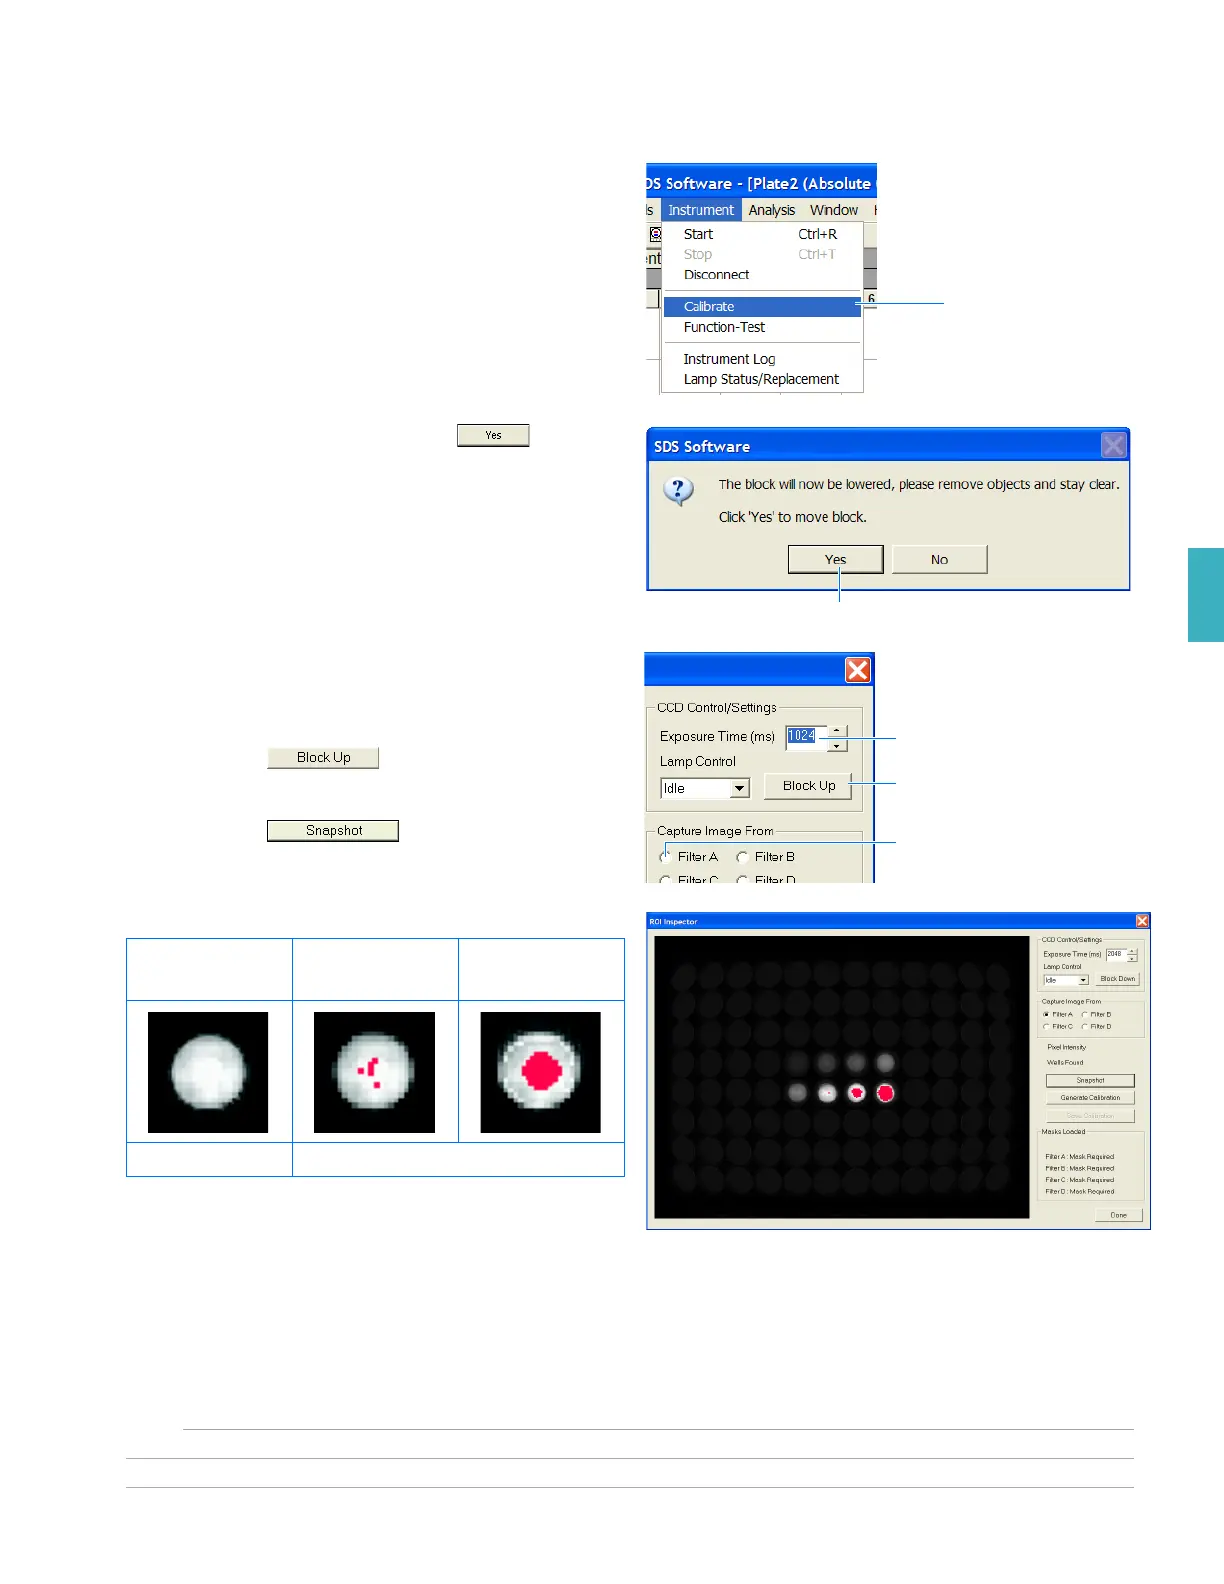
6. In the SDS software, select
InstrumentCalibrate.
7. In the warning dialog box, click to
move the block.
8. In the ROI Inspector, create the ROI image for
each filter, beginning with Filter A:
a. In the Exposure Time field, enter 1024.
b. Click .
c. Select Filter A.
d. Click .
e. Check the image for saturation.
f. Record the coordinate of the well that
displays the brightest possible signal
without saturation. This well contains the
best concentration of the custom pure dye
for Filter A.
Select
Click
a
c
b
No Saturation
Normal
Saturation
Over Saturated
Good Bad