ASE2000 V2 Communication Test Set User Manual 63
Data and carrier signals on each incoming line will be monitored. When sucient data is collected,
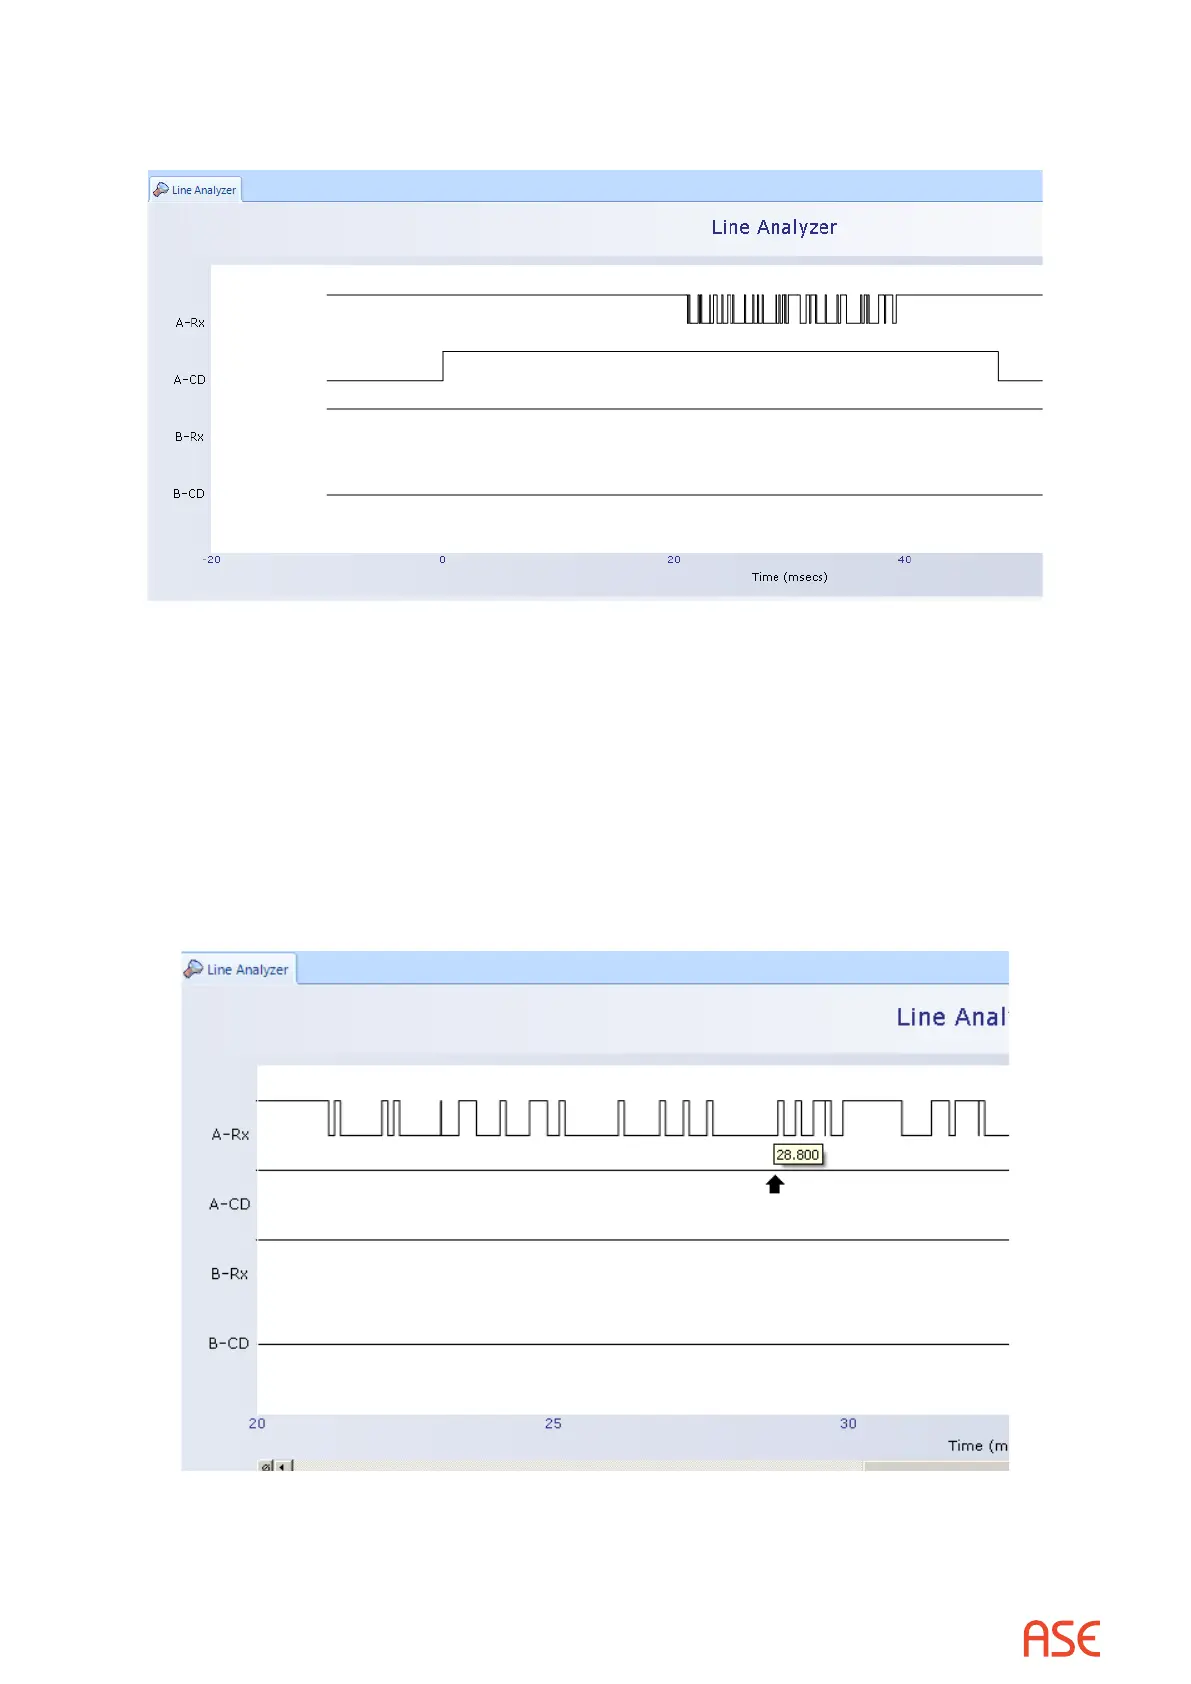
the Line Analyzer view is updated.
The above plot shows data and carrier detected on line A. Plots would also be updated if a
message was detected at about the same time on line B. it was not in this example. A time
reference is shown at the bottom of the view. Several controls are available.
The most useful is zoom:
• Left click on the left edge of an area to zoom
• Keeping the left mouse button pressed and move to the right edge
• Release the mouse button
Proceeding as above on the prior display produces:
Note the expanded data presentation. Also, note that moving the cursor over any point of the plot
shows the time of occurrence of that point. In the example above, the cursor was moved to the
start of a bit occurring at 28.8 milliseconds after the start of data collection.
 Loading...