Balance System SD (with v4.X software) 111
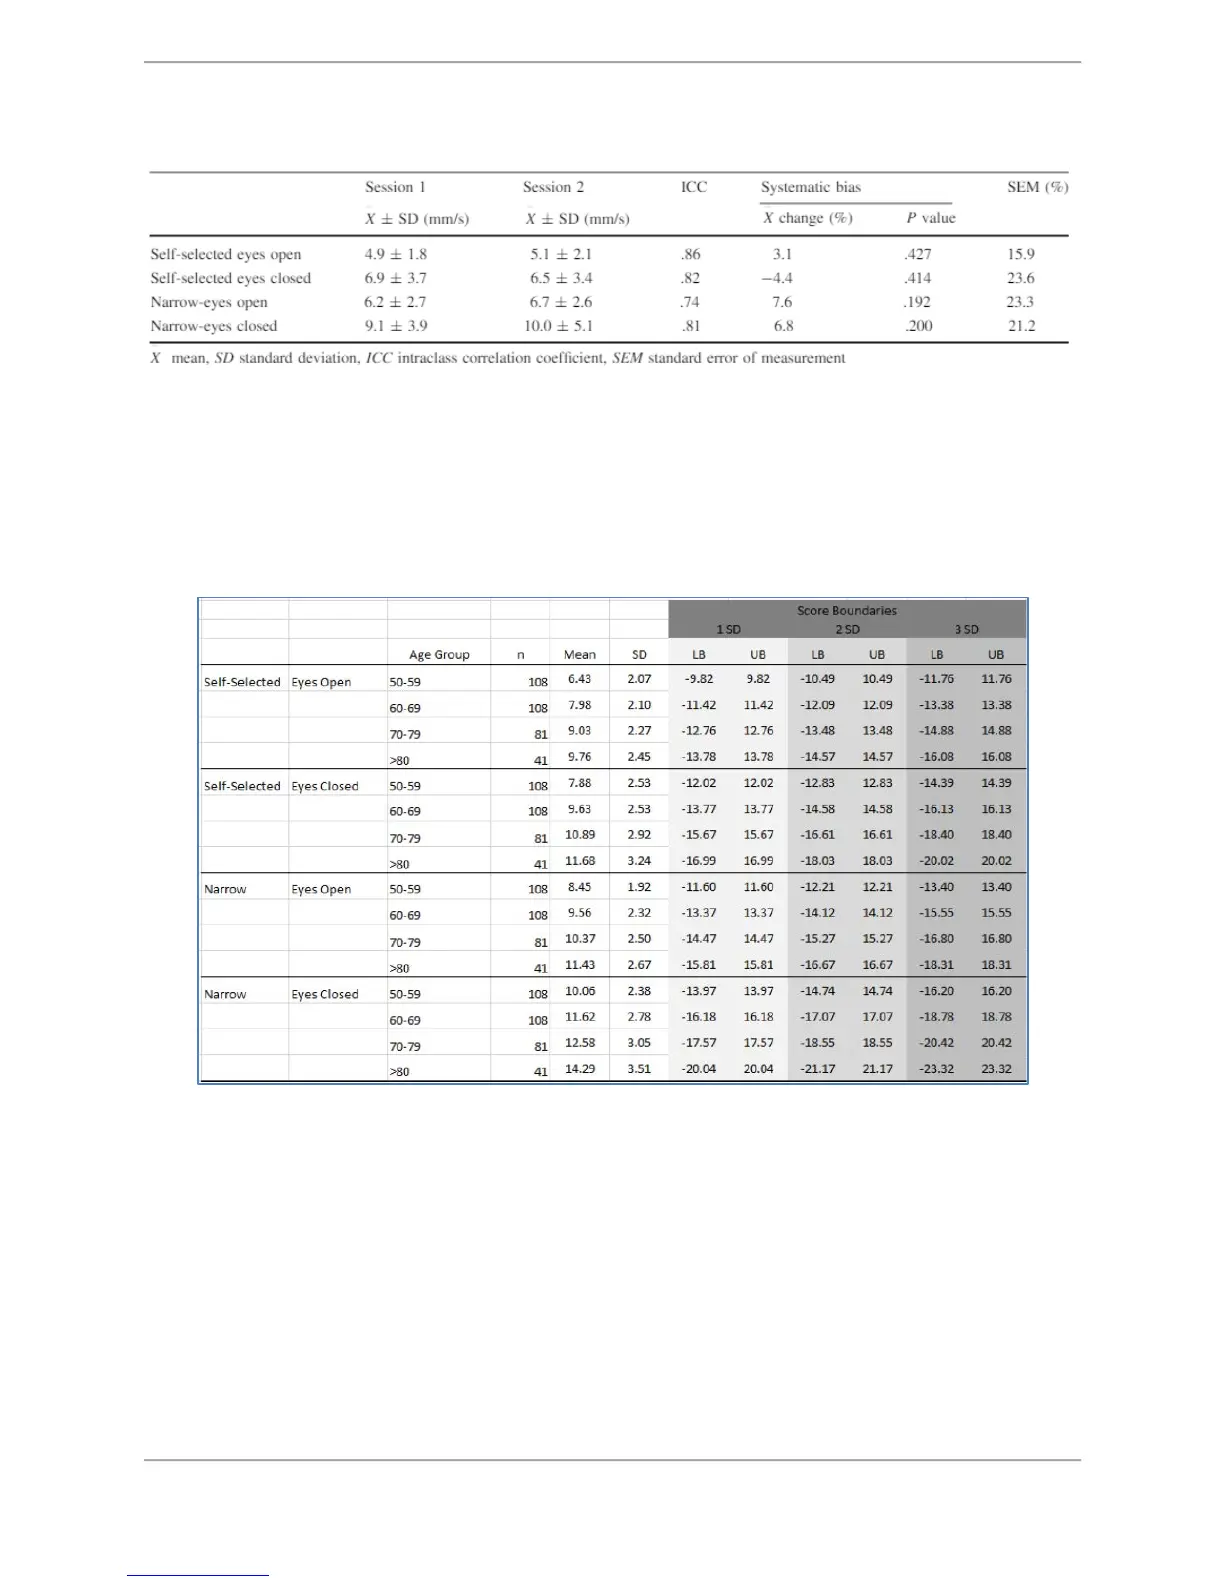
Table 9.2. Descriptive statistics and reliability results between the two testing sessions (1.9 ±.7 day separation) in
thirty older adults
In Table 9.3, note that the mean postural sway velocity of 338 subjects are broken into four Age
Groups. The standard deviations from the mean are separated by three separate boundary
ranges for 1, 2, and 3 SDs. LB refers to the lower boundary in the range and UB refers to the
upper boundary. For the Z-Score in a patient’s Fall Risk Test report, the 1, 2, and 3 SD ranges
are represented by colors green, yellow, and orange, respectively.
Table 9.3. Z-Score boundaries data table for the Fall Risk Test report.
The following is an illustration of the Balance SD Fall Risk defaults, which is an implementation
of above table.