154 Biodex Medical Systems, Inc. © 2017
Appendix D: Log Transformation
REPORT ENHANCEMENTS TO THE CLINICAL TEST OF SENSORY
INTEGRATION AND BALANCE
Bryan L. Riemann PhD ATC
Statistician, PharmIAD, LLC.
Professor and Director,
Biodynamics and Human Performance Center, Armstrong State University
The purpose of this section is to present the methods used to interpret and display an
individual’s score on the Clinical Test of Sensory Integration and Balance (CTSIB) performed on
the Biodex Balance Systems relative to a selected normative database. The Biodex Balance
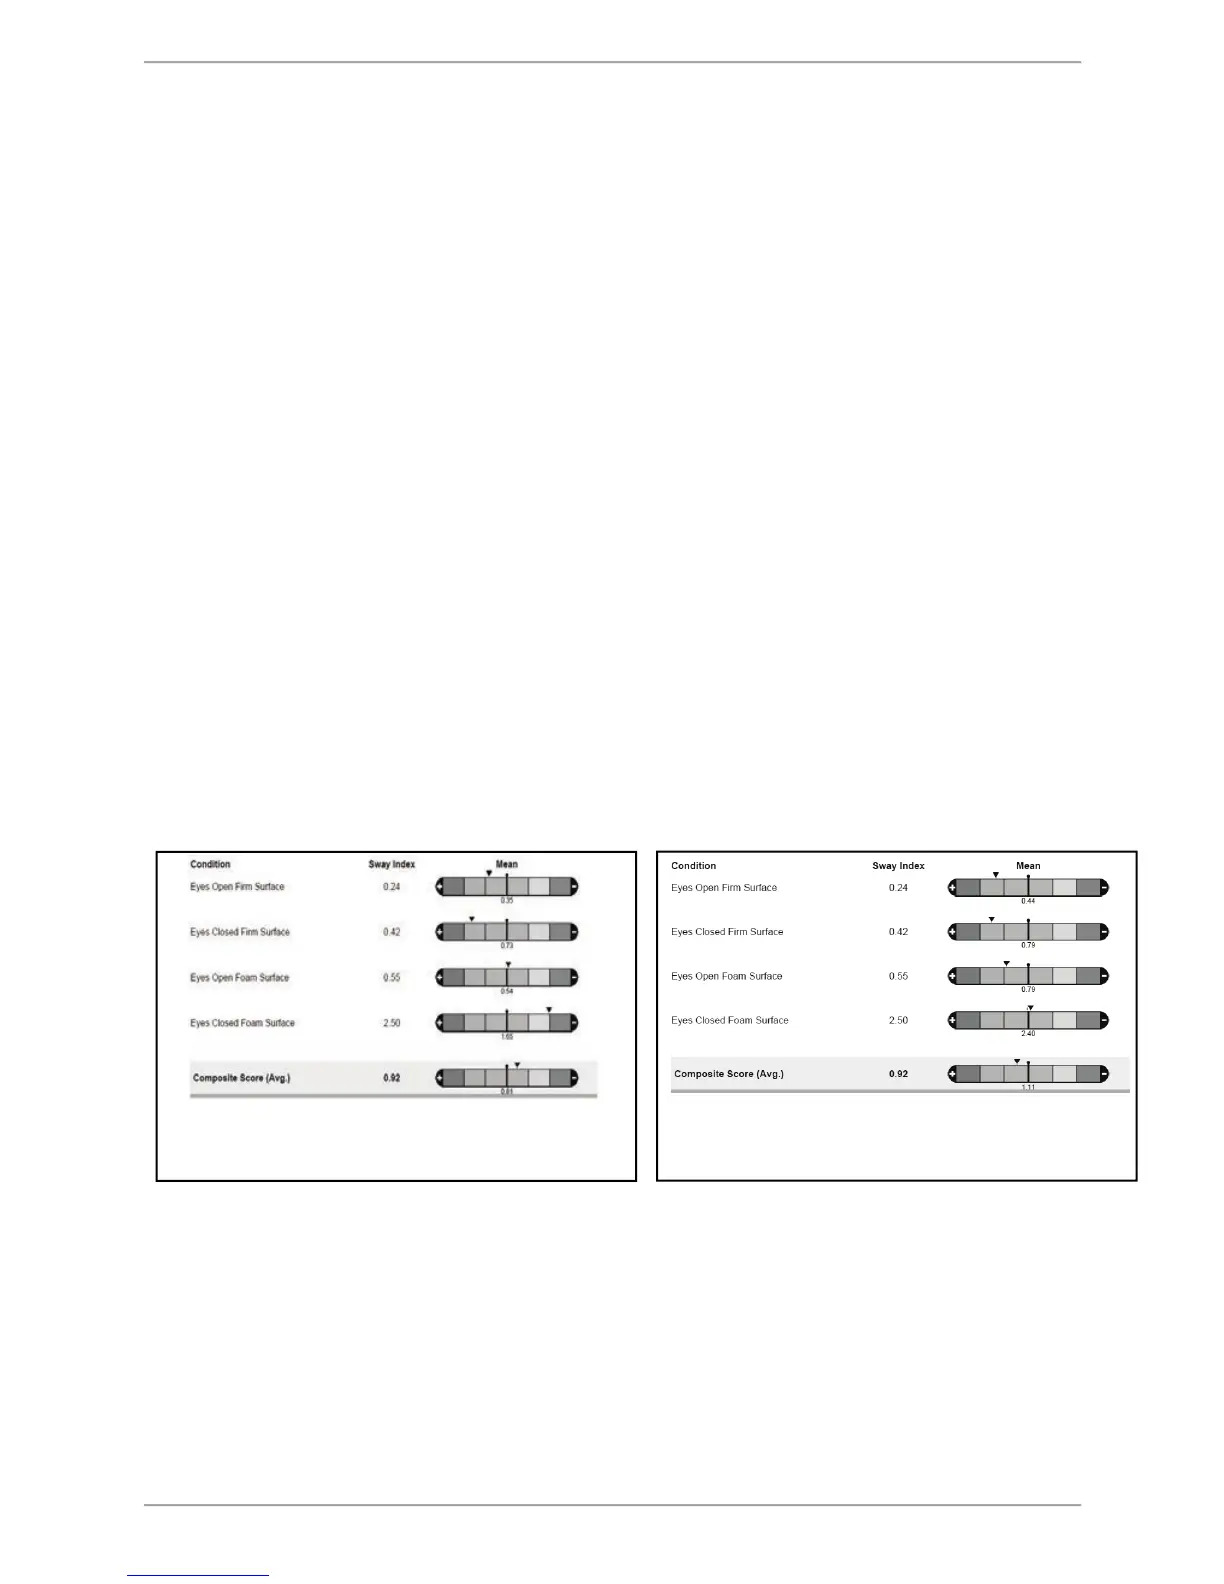
Systems provide line graphs and a mark (i.e., black triangle) depicting the location of an
individual’s CTSIB scores relative to the selected reference database. The middle vertical lines
provide an indication of the reference database mean and the colored bars represent one, two,
and three standard deviation units from the reference database mean. Thus, if the triangle is
located to the right of the black vertical line, the individual scored higher than the reference
database mean, which suggests poorer balance performance. Further, if the triangle appears in
the yellow zone, the patient is between one and two standard deviations units worse than the
mean, and if the triangle appears in the orange zone, the individual scored between two and
three standard deviation units worse than the mean. Thus, practitioners can not only interpret
whether an individual scores better or worse than the reference database mean, but also have
an indication regarding the magnitude of the distance.
Figure D.1 is consistent with how units have always been traditionally provided by previous
Biodex Balance Systems. On Figure D.2, the line graphs are drawn using the selected reference
database that has undergone natural log transformation. The natural log transformation
provides a more accurate method of interpreting the individual’s performance relative to the
Figure D.1. On screen and report output of CTSIB testing with
line graphs in original (raw) units. The color boxes represent
one, two and three standard deviations from the reference
database mean. The triangle represents the individual score
relative to selected reference database.
Figure D.2. On screen and report output of CTSIB testing with
line graphs in natural log transformed units. The color boxes
represent one, two and three standard deviations from the
reference database transformed mean. The triangle represents
the individual score relative to selected reference database.