Balance System SD (with v4.X software) 157
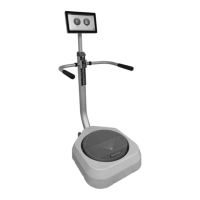
Figure D.5. Distribution of Firm Surface-Eyes Open prior to natural
logarithm transformation (left) and following
transformation (right).
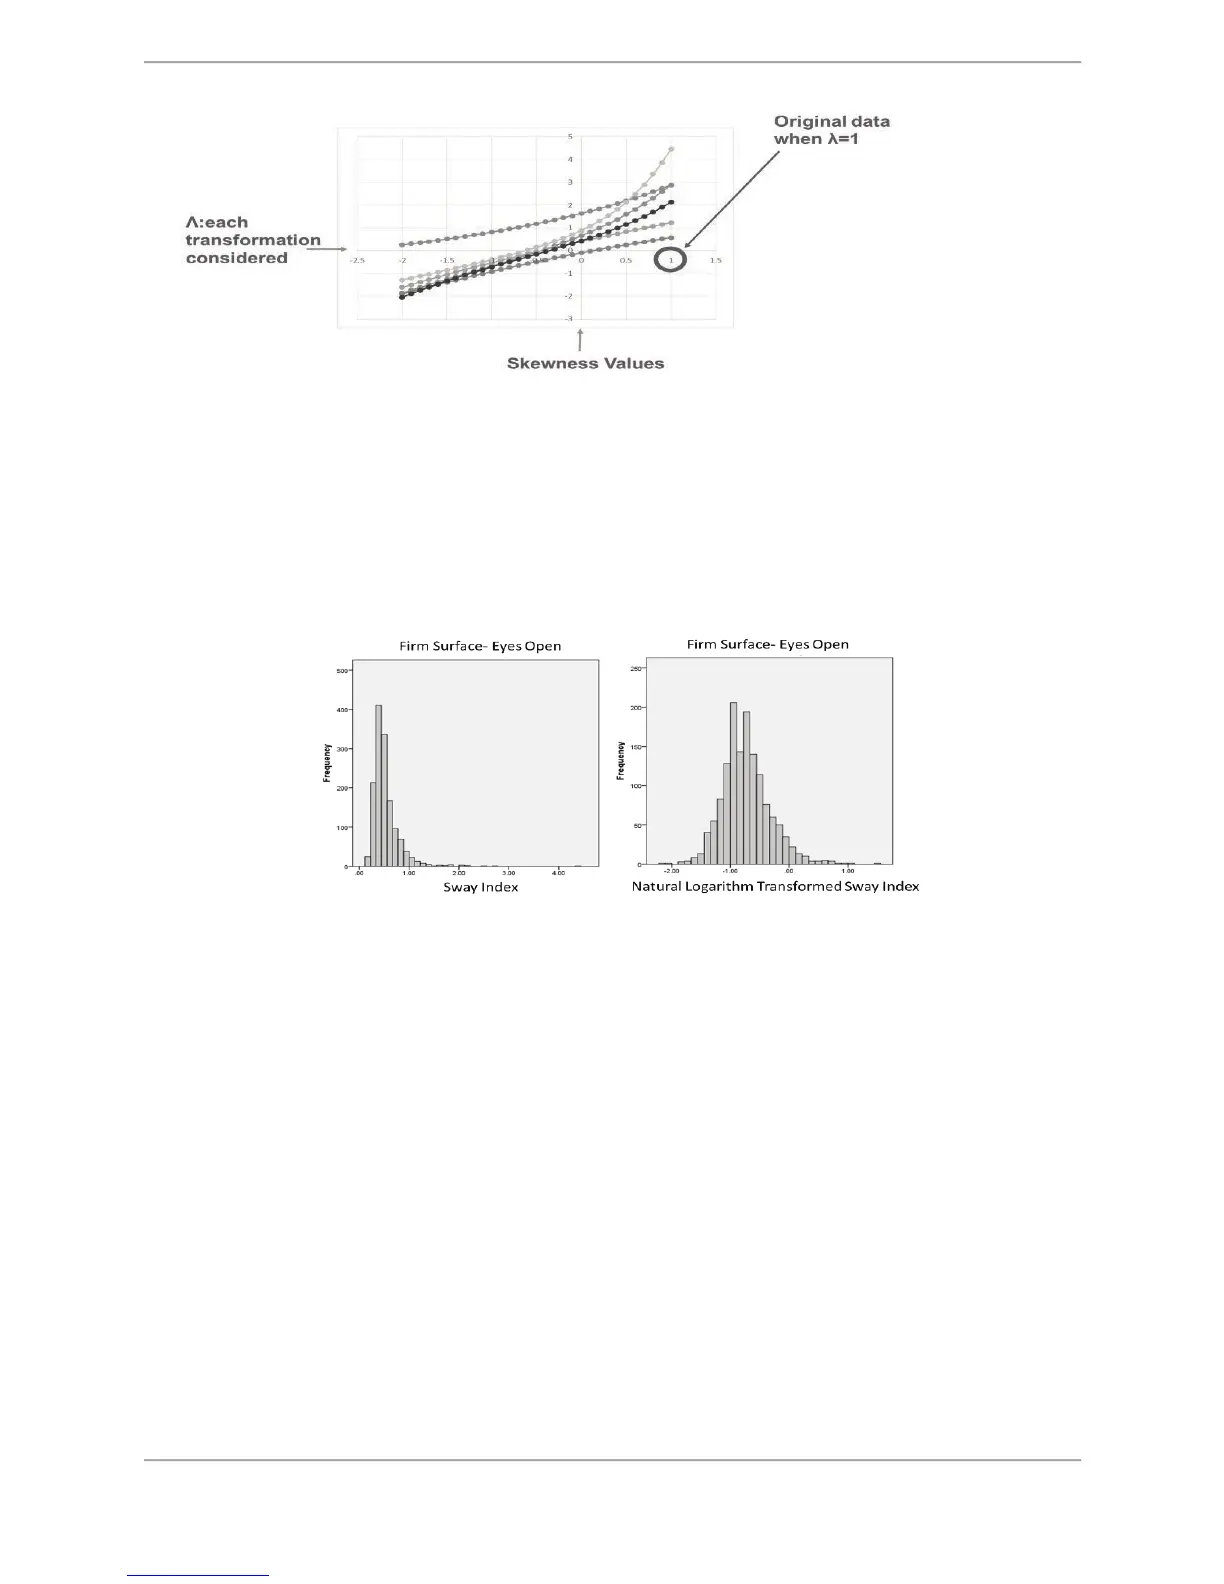
Across the four CTSIB conditions, examination of the plots revealed that a natural logarithm
transformation would best minimize skewness (Figure 5).
In summary, by providing the option to have an individual’s score and reference database
natural logarithm transformed, users can more accurately interpret an individual’s CTSIB
performance proportionally relative to the distribution of the selected reference database.
Figure D.4. Example plot (Firm surface-eyes closed) following the Box-Cox transformational analyses on each of
the reference databases (lines graphed). By examining the plot, the transformation (horizontal axes)
that produces the minimal skewness value (vertical axes) could be identified. On the horizontal axes (!)
zero corresponds to a natural logarithm transformation and one corresponds to the original data (no
transformation).