56
7.4.3 Power contour plot for BCS-815
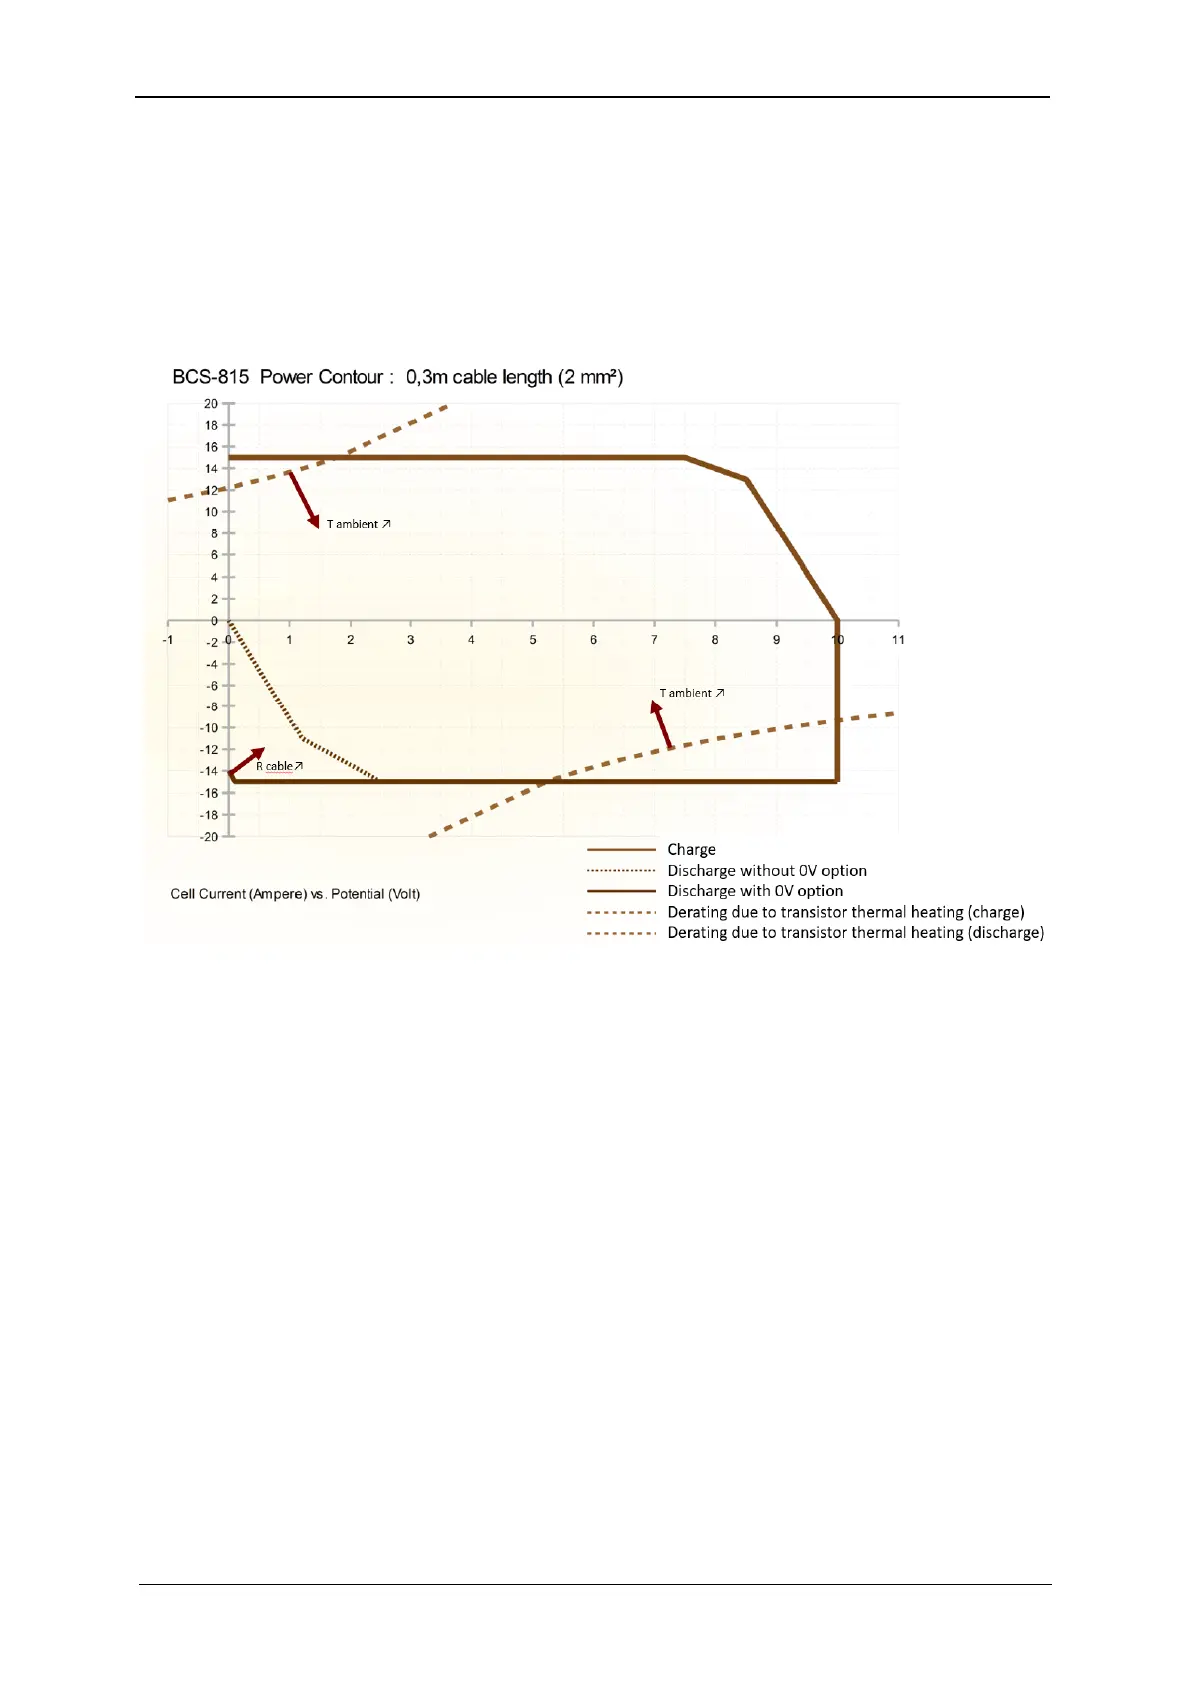
BCS-815 can be provided with cell cables of different length. The figures below show the
power contour plots for 0.3 m, 2.5 m, 5.0 m and 10 m cell cables in standard configuration
and with 0V option.
The following plots for the BCS-815 indicate the influence of the cable length (one plot per
cable length), ambient temperature (derating on top left and bottom right corner) and cable
resistivity (derating on bottom left corner).