being analysed by a particular ETR monitoring engine. For Ethernet
this is the multicast/unicast name, for ASI and demodulators this is
the stream name defined by the operator. If the monitoring engine is
locked to one stream by the user, this field will read LOCKED:
<stream name>.
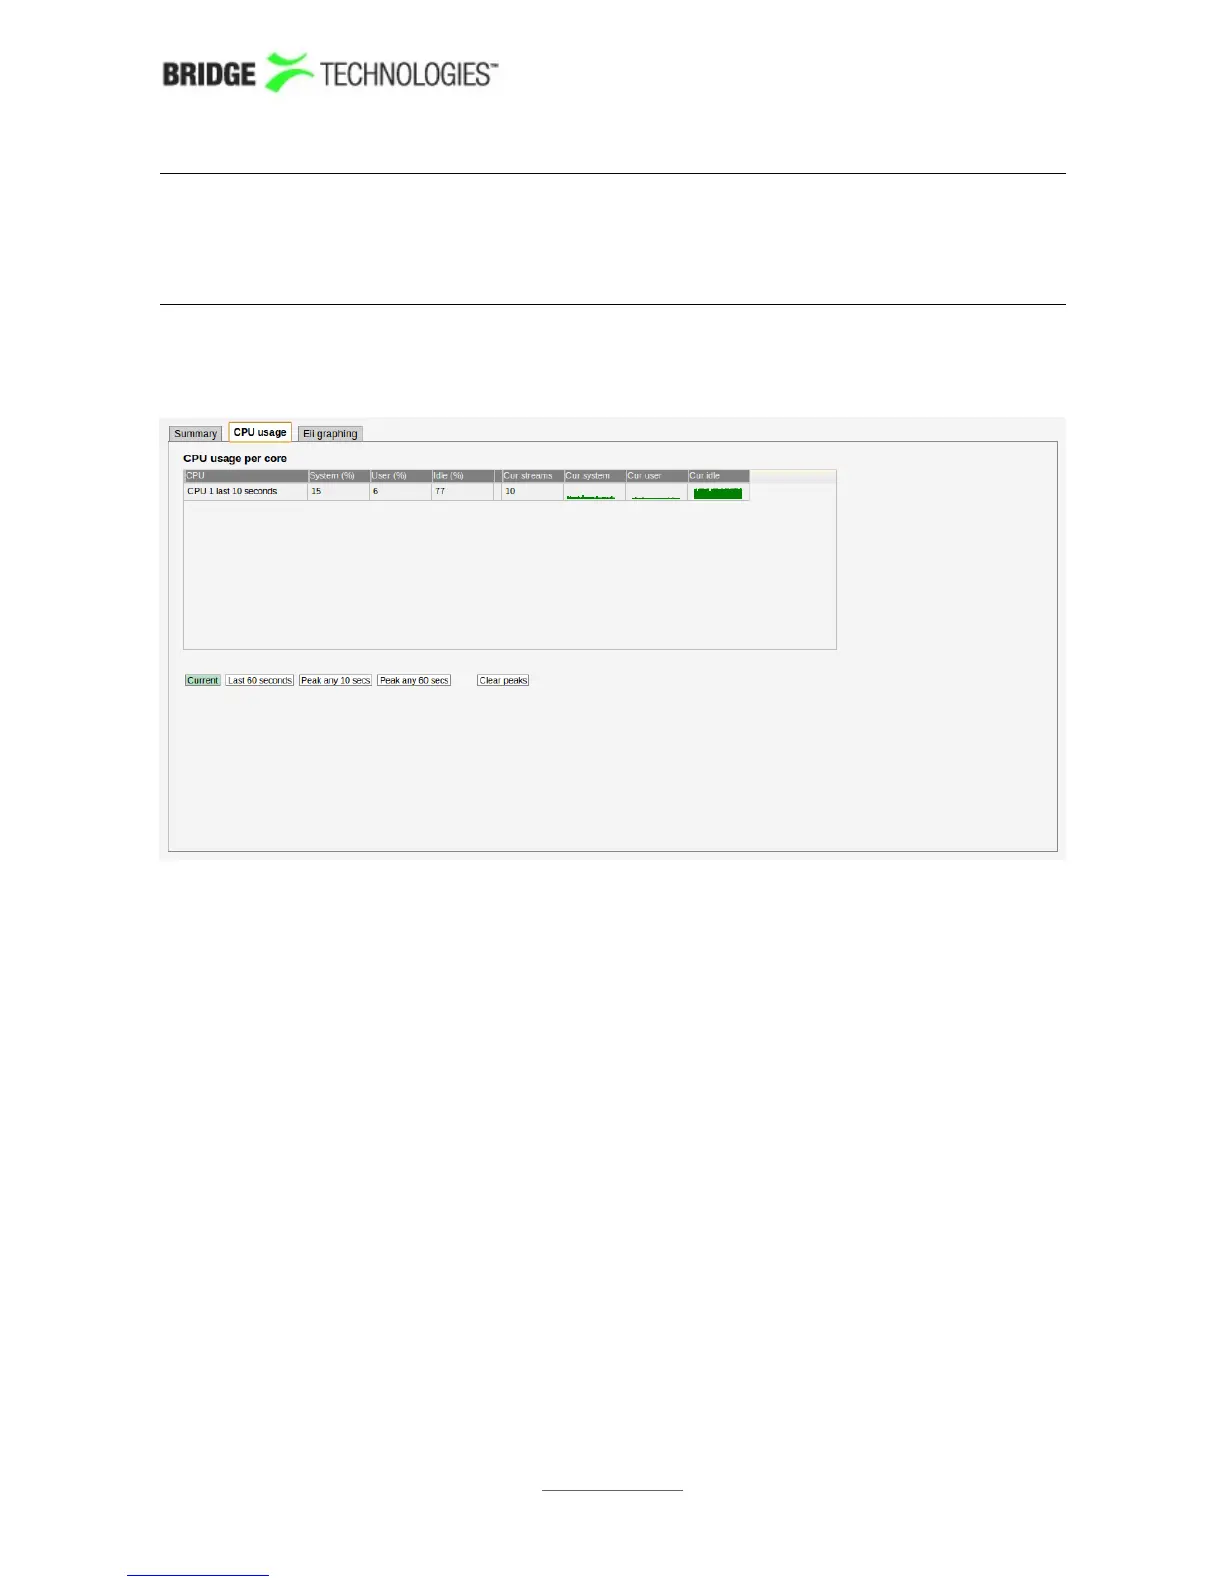
6.1.2 Main - CPU usage
The CPU usage view is meant for troubleshooting performance issues in case of
excessively high traffic load.
Three internal performance indicators (System, User and Idle) are displayed as
percentage numbers and also graphed for the last minute. Issues can potentially arise
if the System indicator becomes high (>80%).
By selecting Current the instantaneous values are sampled and displayed every 2
seconds. Selecting Last 60 seconds displays the peak instantaneous values observed
within the last minute. Selecting Peak any 10 secs performs an averaging over the
last 10 seconds and then registers the highest observed 10-second average since last
time Clear peaks was pressed. Peak any 60 secs is similar only with 60 seconds as
averaging constant instead of 10.
Clear peaks clears the peak values observed until now and starts the peak
registration again.
PROBE USERS' MANUAL VERSION 5.0
2014 © BRIDGE Technologies Co AS - Bentsebrugata 20 - N-0476 Oslo, Norway - tel: +47 22 38 51 00 -
www.bridgetech.tv
52