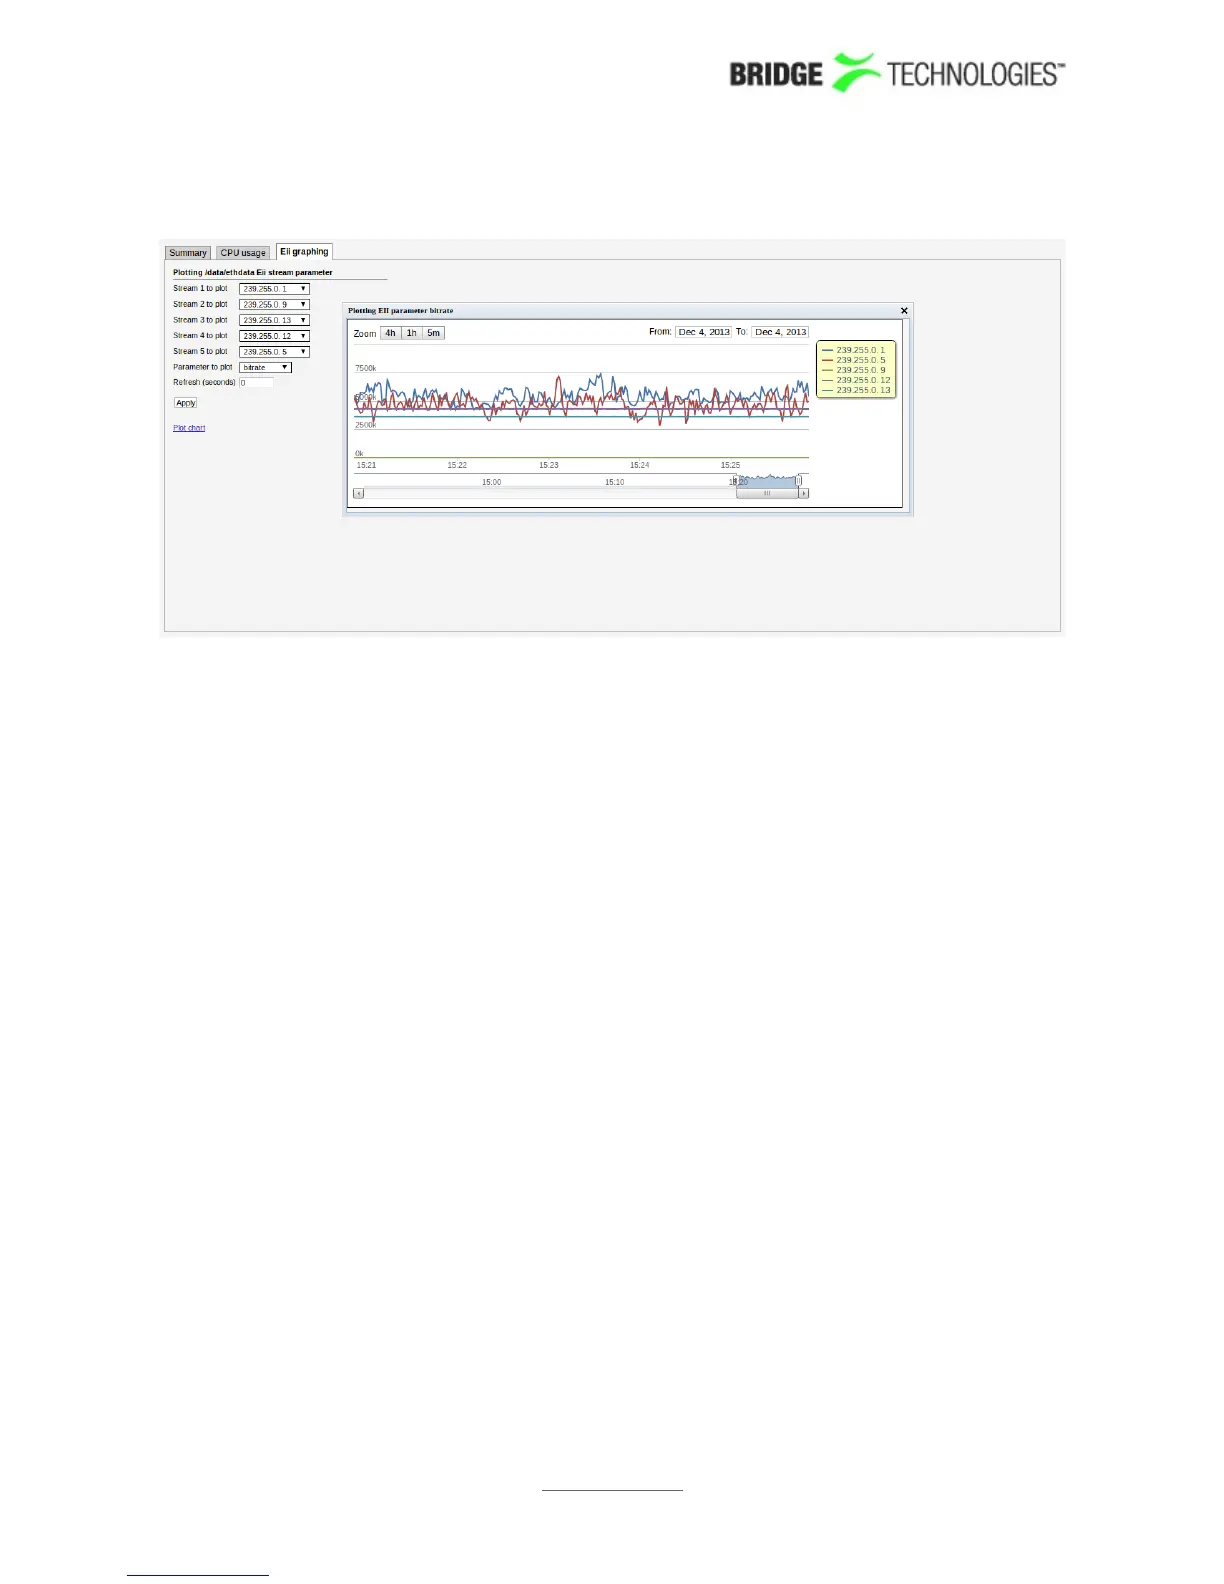
6.1.3 Main - Eii graphing
Eii is short for External Integration Interface and constitutes a set of XML files
accessible through the probe web server interface for machine access to
measurement data.
Portions of the Eii interface are available in this view for simple trend graphing over
arbitrary long time by the web browser.
The screenshot shows the bandwidth of two IP streams being graphed by sampling the
Eii interface every 2 seconds. The graph is stored in the client web browser for as long
as the graph window remains open. The graph starts again with zero history if the
window is closed and then opened again.
Up to 5 streams are possible to plot on the same graph using the dropdown menus
named Stream N to plot where N is 1 through to 5. The parameter to plot is selected
through the dropdown called Parameter to plot. The following choices are available:
bitrate
rtp_drops
iat_avg
cc_errs
Refresh (seconds) selects how often samples are read and plotted on the graph.
See separate Eii documentation on the customer area of the BRIDGE Technologies
website for more details.
PROBE USERS' MANUAL VERSION 5.0
2014 © BRIDGE Technologies Co AS - Bentsebrugata 20 - N-0476 Oslo, Norway - tel: +47 22 38 51 00 -
www.bridgetech.tv
53