Using Vision64 5-13
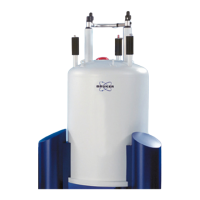
Figure 5-18: Bearing Ratio Analysis Dialog Box
3D MAPPING Option
If your Vision64 software includes the 3D Mapping Option, the user interface and workflow operate
somewhat differently than described in this chapter. For example, the Data Visualization Taskbar
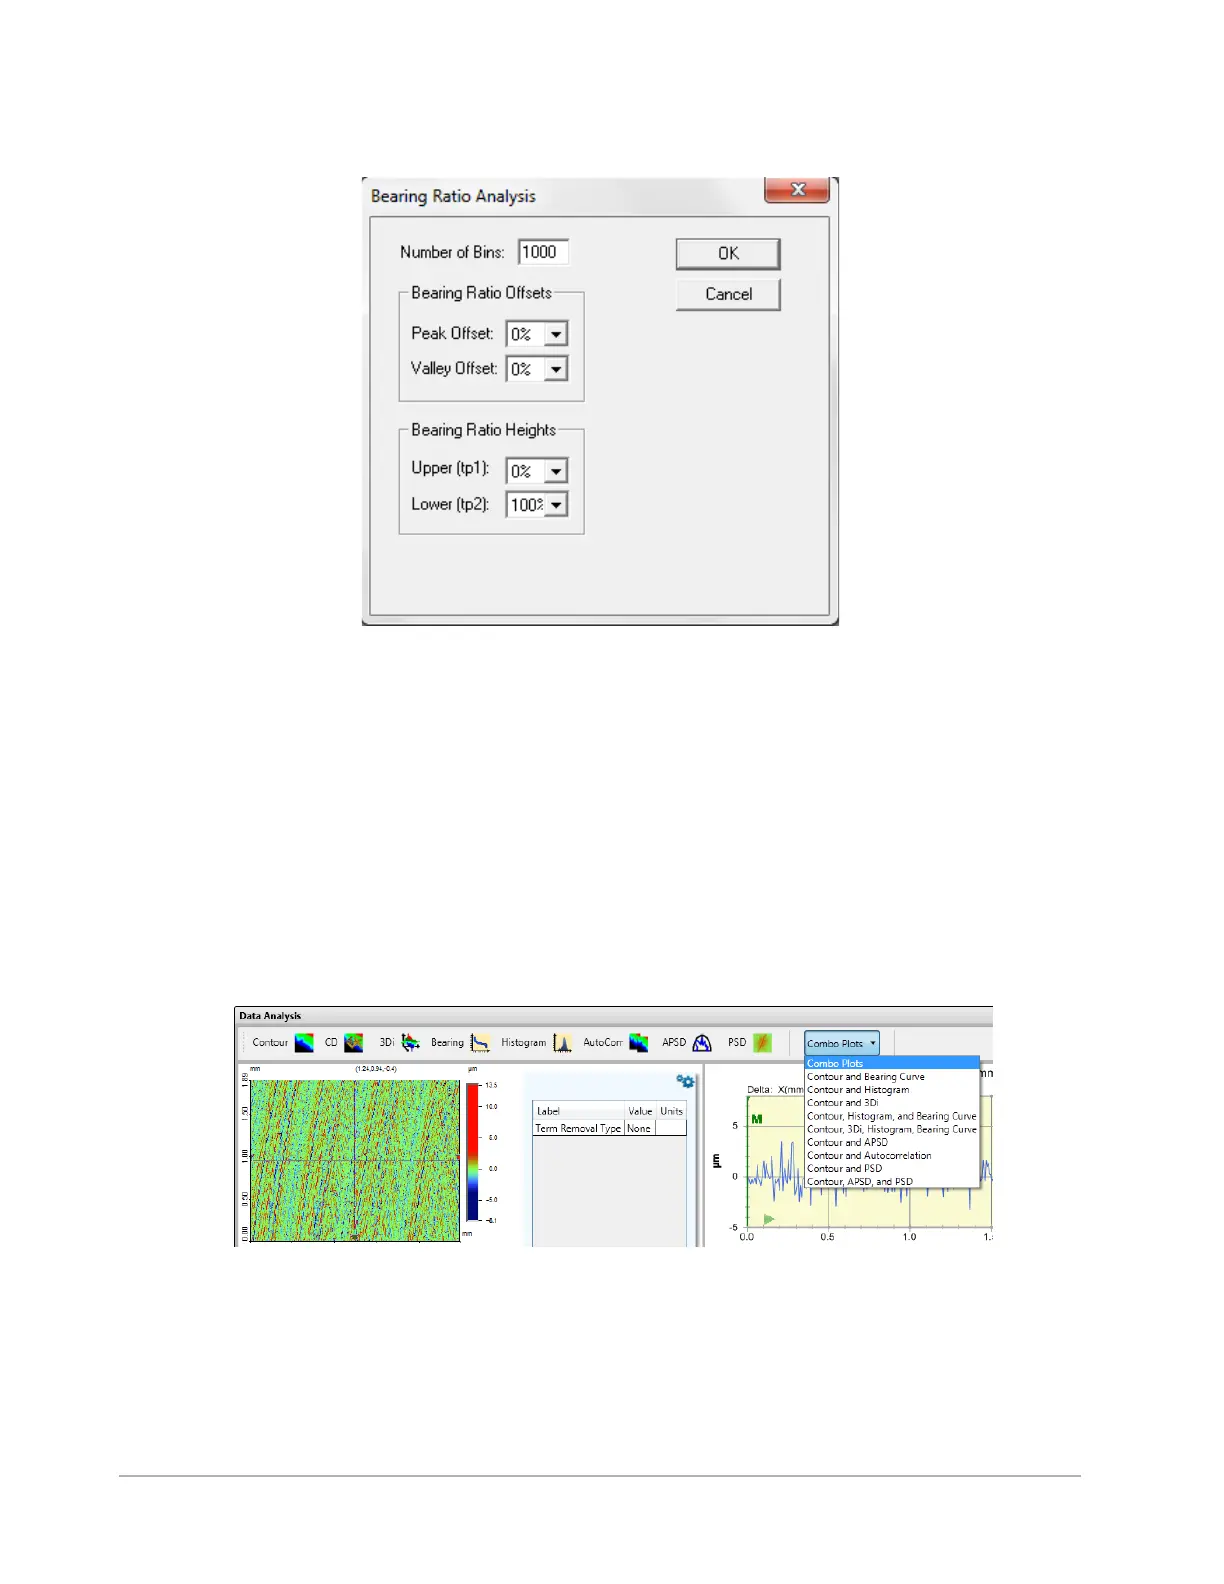
allows you to quickly change the displayed plot while the Combo Plot drop-down list lets you select
combination plots for display (see Figure 5-19). For more information about the 3D Mapping Option,
see your Vision64 online
Help.
Figure 5-19: Data Visualization Taskbar and Combo Plot Drop-down List
 Loading...